透视表(pivot table)数据汇总分析工具。
根据一个或多个键对数据进行聚合,并根据行和列上的分组键将数据分配到各个矩形区域中。
1、在Python和pandas中,通过groupby功能以及重塑运算制作透视表
2、DataFrame有一个pivot_table 方法
3、顶级的pandas.pivot_table函数
pivot_table 可以添加分项小计
小费数据集,根据sex和smoker计算分组平均值,并将sex和smoker放到行上
1 #书中是rows,但是没办法运行
2 tips.pivot_table(index=['sex','smoker'])
3 Out[42]:
4                    size       tip   tip_pct  total_bill
5 sex    smoker
6 Female No      2.592593  2.773519  0.156921   18.105185
7        Yes     2.242424  2.931515  0.182150   17.977879
8 Male   No      2.711340  3.113402  0.160669   19.791237
9        Yes     2.500000  3.051167  0.152771   22.284500
只聚合tip_pct和size,根据day分组,smoker在列上,day 在行上:
 1 tips.pivot_table(['tip_pct','size'],index=['sex','day'],columns='smoker')
 2 Out[43]:
 3                  size             tip_pct
 4 smoker             No       Yes        No       Yes
 5 sex    day
 6 Female Fri   2.500000  2.000000  0.165296  0.209129
 7        Sat   2.307692  2.200000  0.147993  0.163817
 8        Sun   3.071429  2.500000  0.165710  0.237075
 9        Thur  2.480000  2.428571  0.155971  0.163073
10 Male   Fri   2.000000  2.125000  0.138005  0.144730
11        Sat   2.656250  2.629630  0.162132  0.139067
12        Sun   2.883721  2.600000  0.158291  0.173964
13        Thur  2.500000  2.300000  0.165706  0.164417
传入margins=True添加分项小计
 1 tips.pivot_table(['tip_pct','size'],index=['sex','day'],
 2 columns='smoker',margins=True)
 3 Out[44]:
 4                  size                       tip_pct
 5 smoker             No       Yes       All        No       Yes       All
 6 sex    day
 7 Female Fri   2.500000  2.000000  2.111111  0.165296  0.209129  0.199388
 8        Sat   2.307692  2.200000  2.250000  0.147993  0.163817  0.156470
 9        Sun   3.071429  2.500000  2.944444  0.165710  0.237075  0.181569
10        Thur  2.480000  2.428571  2.468750  0.155971  0.163073  0.157525
11 Male   Fri   2.000000  2.125000  2.100000  0.138005  0.144730  0.143385
12        Sat   2.656250  2.629630  2.644068  0.162132  0.139067  0.151577
13        Sun   2.883721  2.600000  2.810345  0.158291  0.173964  0.162344
14        Thur  2.500000  2.300000  2.433333  0.165706  0.164417  0.165276
15 All          2.668874  2.408602  2.569672  0.159328  0.163196  0.160803
想使用其他聚合函数,将其传给aggfunc
tips.pivot_table('tip_pct',index=['sex','smoker'],columns='day',
aggfunc=len,margins=True)
Out[45]:
day             Fri   Sat   Sun  Thur    All
sex    smoker
Female No       2.0  13.0  14.0  25.0   54.0
       Yes      7.0  15.0   4.0   7.0   33.0
Male   No       2.0  32.0  43.0  20.0   97.0
       Yes      8.0  27.0  15.0  10.0   60.0
All            19.0  87.0  76.0  62.0  244.0
存在NA值,设置一个fill_value:
 1 tips.pivot_table('size',index=['time','sex','smoker'],columns='day',aggfunc='sum',fill_value=0)
 2 Out[46]:
 3 day                   Fri  Sat  Sun  Thur
 4 time   sex    smoker
 5 Dinner Female No        2   30   43     2
 6               Yes       8   33   10     0
 7        Male   No        4   85  124     0
 8               Yes      12   71   39     0
 9 Lunch  Female No        3    0    0    60
10               Yes       6    0    0    17
11        Male   No        0    0    0    50
12               Yes       5    0    0    23
pivot_table参数:

values:待聚合的列的名称,默认聚合所有的数值列。
index:用于分组的列名或其他分组键,出现在结果透视表的行
columns:用于分组的列名或其他分组键,出现在结果透视表的列
aggfunc:聚合函数或函数列表,默认为'mean'。
fill_value:用于替换结果表中的缺失值
margins:添加行/列小计和总计,默认为False
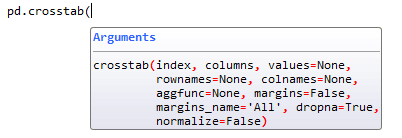
交叉表
交叉表(crosstab)是一种用于计算分组频率的特殊透视表。
 1 #书中没有这个data数据,自己创建一个
 2 data=pd.read_excel(r'C:\Users\Administrator\Desktop\data.xlsx')
 3
 4 data
 5 Out[50]:
 6    Sample  Gender    Handedness
 7 0       1  Female  Right-handed
 8 1       2    Male   Left-handed
 9 2       3  Female  Right-handed
10 3       4    Male  Right-handed
11 4       5    Male   Left-handed
12 5       6    Male  Right-handed
13 6       7  Female  Right-handed
14 7       8  Female   Left-handed
15 8       9    Male  Right-handed
16 9      10  Female  Right-handed
17 #使用pandas.crosstab
18 pd.crosstab(data.Gender,data.Handedness,margins=True)
19 Out[51]:
20 Handedness  Left-handed  Right-handed  All
21 Gender
22 Female                1             4    5
23 Male                  2             3    5
24 All                   3             7   10
25
26 #crosstab的前2个参数可以是数组、Series或数组列表
27 pd.crosstab([tips.time,tips.day],tips.smoker,margins=True)
28 Out[52]:
29 smoker        No  Yes  All
30 time   day
31 Dinner Fri     3    9   12
32        Sat    45   42   87
33        Sun    57   19   76
34        Thur    1    0    1
35 Lunch  Fri     1    6    7
36        Thur   44   17   61
37 All          151   93  244
crosstab函数的参数: