前言:决策树(Decision Tree)是一种基本的分类与回归方法,本文主要讨论分类决策树。决策树模型呈树形结构,在分类问题中,表示基于特征对实例进行分类的过程。它可以认为是if-then规则的集合,也可以认为是定义在特征空间与类空间上的条件概率分布。相比朴素贝叶斯分类,决策树的优势在于构造过程不需要任何领域知识或参数设置,因此在实际应用中,对于探测式的知识发现,决策树更加适用。
一、决策树模型
1.定义
分类决策树模型是一种描述对实例进行分类的树形结构。决策树由结点和有向边组成。结点有两种类型:内部节点和叶节点,内部节点表示一个特征或属性,叶节点表示一个类。
分类的时候,从根节点开始,对实例的某一个特征进行测试,根据测试结果,将实例分配到其子结点;此时,每一个子结点对应着该特征的一个取值。如此递归向下移动,直至达到叶结点,最后将实例分配到叶结点的类中。
举一个通俗的栗子,各位立志于脱单的单身男女在找对象的时候就已经完完全全使用了决策树的思想。假设一位母亲在给女儿介绍对象时,有这么一段对话:
母亲:给你介绍个对象。
女儿:年纪多大了?
母亲:26。
女儿:长的帅不帅?
母亲:挺帅的。
女儿:收入高不?
母亲:不算很高,中等情况。
女儿:是公务员不?
母亲:是,在税务局上班呢。
女儿:那好,我去见见。
- 1
- 2
- 3
- 4
- 5
- 6
- 7
- 8
- 9
- 10
- 11
这个女生的决策过程就是典型的分类决策树。相当于对年龄、外貌、收入和是否公务员等特征将男人分为两个类别:见或者不见。假设这个女生的决策逻辑如下:
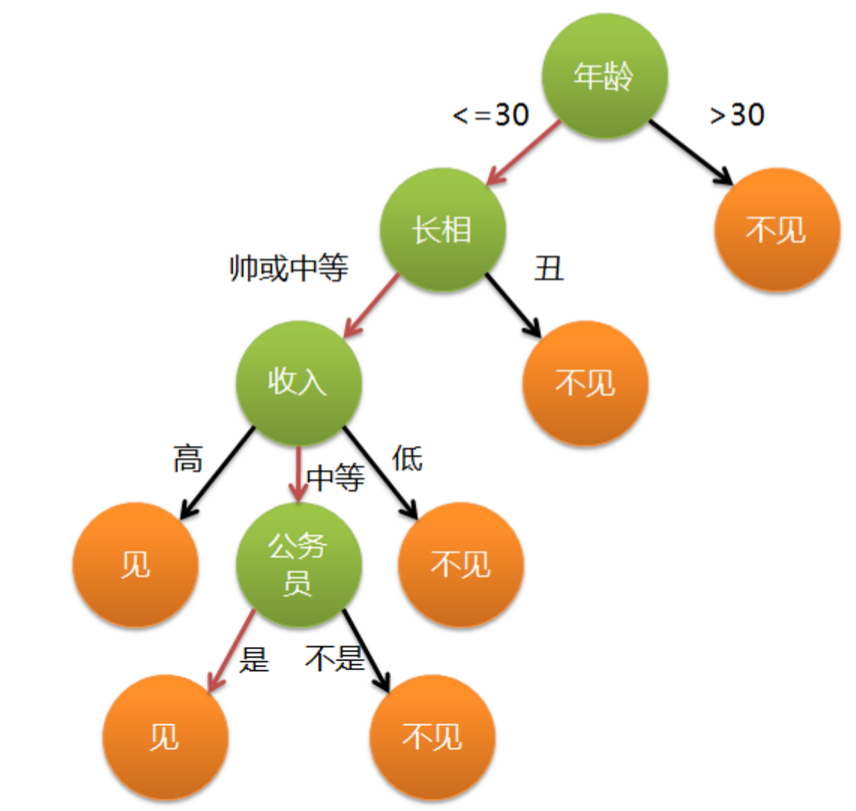
上图完整表达了这个女孩决定是否见一个约会对象的策略,其中绿色结点(内部结点)表示判断条件,橙色结点(叶结点)表示决策结果,箭头表示在一个判断条件在不同情况下的决策路径,图中红色箭头表示了上面例子中女孩的决策过程。
这幅图基本可以算是一棵决策树,说它“基本可以算”是因为图中的判定条件没有量化,如收入高中低等等,还不能算是严格意义上的决策树,如果将所有条件量化,则就变成真正的决策树了。(以上的决策树模型纯属瞎编乱造,不代表任何女生的择偶观,旨在直观理解决策树,各位女同志无须在此挑刺。。。)
2.决策树与if-then规则
现在我们可以更抽象一些。决策树可以看成一个if-then规则的集合:由决策树的根结点到叶结点的每一条路径构建一条规则;路径上的内部结点的特征对应着规则的条件,而叶结点对应着分类的结论。决策树的路径和其对应的if-then规则集合是等效的,它们具有一个重要的性质:互斥并且完备。这里的意思是说:每一个实例都被一条路径或一条规则所覆盖,而且只被一条规则所覆盖。
3.决策树与条件概率分布
决策树还是给定特征条件下类的条件概率分布的一种表示。该条件分布定义在特征空间的划分(partition)上,特征空间被划分为互不相交的单元(cell),每个单元定义一个类的概率分布就构成了一个条件概率分布。决策树的一条路径对应于划分中的一个单元。决策树所表示的条件概率分布由各个单元给定条件下类的条件概率分布组成。给定实例的特征X,一定落入某个划分,决策树选取该划分里最大概率的类作为结果输出。如图:
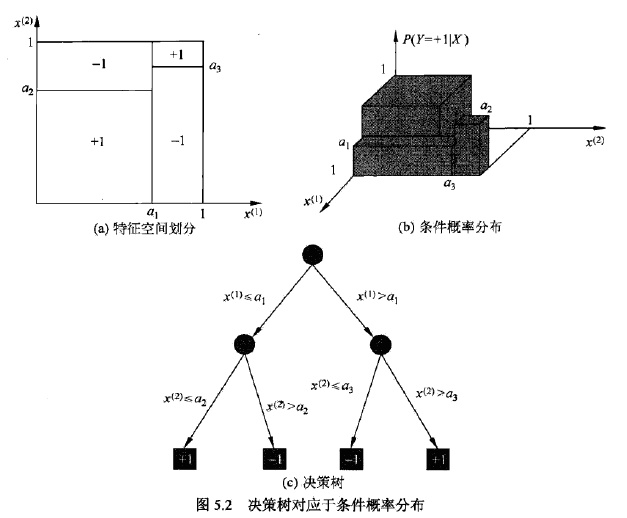
图(a)表示该实例的特征向量是二维的(即具有两个特征),图(b)表示给定特征X” role=”presentation”>XX)。
4.决策树的学习
决策树学习算法包含特征选择、决策树的生成与剪枝过程。决策树的学习算法通常是递归地选择最优特征,并用最优特征对数据集进行分割。开始时,构建根结点,选择最优特征,该特征有几种值就分割为几个子集,每个子集分别递归调用此方法,返回结点,返回的结点就是上一层的子结点。直到所有特征都已经用完,或者数据集只有一维特征为止。
二、特征选择
特征选择问题希望选取对训练数据具有良好分类能力的特征,这样可以提高决策树学习的效率。如果利用一个特征进行分类的结果与随机分类的结果没有很大差别,则称这个特征是没有分类能力的(对象是否喜欢打游戏应该不会成为关键特征吧,也许也会……)。为了解决特征选择问题,找出最优特征,先要介绍一些信息论里面的概念。
1.熵(entropy)
熵是表示随机变量不确定性的度量。设X” role=”presentation”>XX,当对数的底为2时,熵的单位为bit;为e时,单位为nat。
熵越大,随机变量的不确定性就越大。从定义可验证
Python实现代码如下:
def calcShannonEnt(dataSet):
    '''
    计算香农熵
    :param dataSet:数据集
    :return: 计算结果
    '''
    numEntries = len(dataSet)
    labelCounts = {}
    for featVec in dataSet: # 遍历每个实例,统计标签的频数
        currentLabel = featVec[-1]
        if currentLabel not in labelCounts.keys():
            labelCounts[currentLabel] = 0
        labelCounts[currentLabel] += 1
    shannonEnt = 0.0
    for key in labelCounts:
        prob = float(labelCounts[key]) / numEntries
        shannonEnt -= prob * log(prob,2) # 以2为底的对数
    return shannonEnt
- 1
- 2
- 3
- 4
- 5
- 6
- 7
- 8
- 9
- 10
- 11
- 12
- 13
- 14
- 15
- 16
- 17
- 18
2.条件熵(conditional entropy)
设有随机变量(X,Y)” role=”presentation”>(X,Y)(X,Y)
Python实现代码如下:
def splitDataSet(dataSet, axis, value):
    '''
    按照给定特征划分数据集
    :param dataSet:待划分的数据集
    :param axis:划分数据集的特征
    :param value: 需要返回的特征的值
    :return: 划分结果列表
    '''
    retDataSet = []
    for featVec in dataSet:
        if featVec[axis] == value:
            reducedFeatVec = featVec[:axis]     #chop out axis used for splitting
            reducedFeatVec.extend(featVec[axis+1:])
            retDataSet.append(reducedFeatVec)
    return retDataSet

def calcConditionalEntropy(dataSet, i, featList, uniqueVals):
    '''
    计算X_i给定的条件下,Y的条件熵
    :param dataSet:数据集
    :param i:维度i
    :param featList: 数据集特征列表
    :param uniqueVals: 数据集特征集合
    :return: 条件熵
    '''
    conditionEnt = 0.0
    for value in uniqueVals:
        subDataSet = splitDataSet(dataSet, i, value)
        prob = len(subDataSet) / float(len(dataSet))  # 极大似然估计概率
        conditionEnt += prob * calcShannonEnt(subDataSet)  # 条件熵的计算
    return conditionEnt
- 1
- 2
- 3
- 4
- 5
- 6
- 7
- 8
- 9
- 10
- 11
- 12
- 13
- 14
- 15
- 16
- 17
- 18
- 19
- 20
- 21
- 22
- 23
- 24
- 25
- 26
- 27
- 28
- 29
- 30
- 31
3.信息增益(information gain)
信息增益表示得知特征X” role=”presentation”>XX这个差又称为互信息。信息增益大的特征具有更强的分类能力。
根据信息增益准则的特征选择方法是:对训练数据集(或子集)计算其每个特征的信息增益,选择信息增益最大的特征。
计算信息增益的算法如下:
输入:训练数据集D” role=”presentation”>DD;
输出:特征A” role=”presentation”>AA.
(1)计算数据集D” role=”presentation”>DD (2)计算特征A” role=”presentation”>AA
(3)计算信息增益
Python实现如下:
def calcInformationGain(dataSet, baseEntropy, i):
    '''
    计算信息增益
    :param dataSet:数据集
    :param baseEntropy:数据集的信息熵
    :param i: 特征维度i
    :return: 特征i对数据集的信息增益g(D|X_i)
    '''
    featList = [example[i] for example in dataSet]  # 第i维特征列表
    uniqueVals = set(featList)  # 转换成集合
    newEntropy = calcConditionalEntropy(dataSet, i, featList, uniqueVals)
    infoGain = baseEntropy - newEntropy  # 信息增益,就yes熵的减少,也就yes不确定性的减少
    return infoGain
- 1
- 2
- 3
- 4
- 5
- 6
- 7
- 8
- 9
- 10
- 11
- 12
- 13
相对应地,以信息增益作为划分训练数据集的特征的算法称为ID3算法,后面会讲述。
4.信息增益比(information gain ratio)
特征A” role=”presentation”>AA取值的个数。
Python实现如下:
def calcInformationGainRatio(dataSet, baseEntropy, i):
    '''
    计算信息增益比
    :param dataSet:数据集
    :param baseEntropy:数据集的信息熵
    :param i: 特征维度i
    :return: 特征i对数据集的信息增益比gR(D|X_i)
    '''
    return calcInformationGain(dataSet, baseEntropy, i) / baseEntropy
- 1
- 2
- 3
- 4
- 5
- 6
- 7
- 8
- 9
- 10
相应地,用信息增益比来选择特征的算法称为C4.5算法。
三、决策树的生成
此处主要介绍两种决策树学习的生成算法:ID3和C4.5。
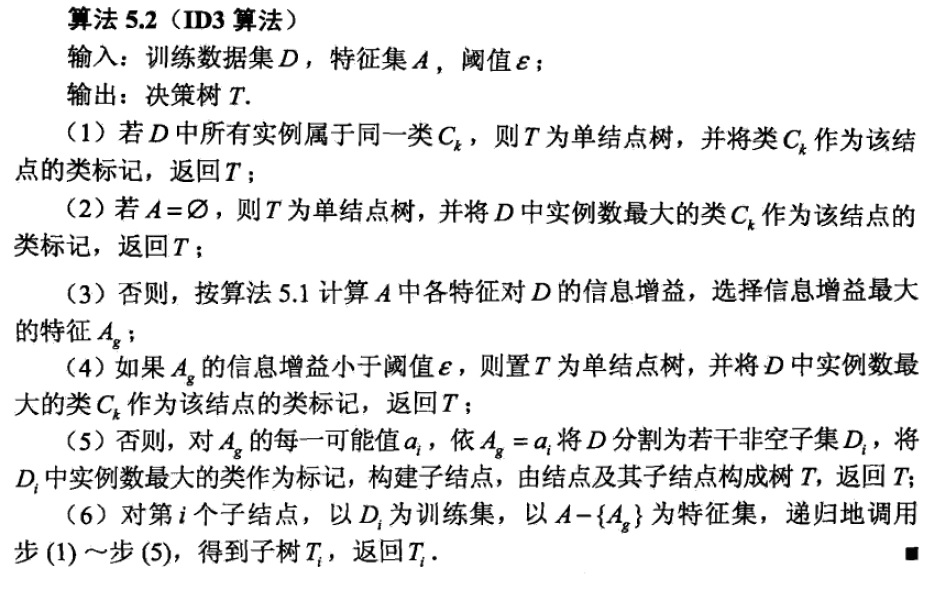
1.ID3算法
ID3算法由Ross Quinlan发明,建立在“奥卡姆剃刀”的基础上:越是小型的决策树越优于大的决策树(be simple简单理论)。ID3算法中根据信息增益评估和选择特征,每次选择信息增益最大的特征作为判断模块建立子结点。ID3算法可用于划分标称型数据集,没有剪枝的过程,为了去除过度数据匹配的问题,可通过裁剪合并相邻的无法产生大量信息增益的叶子节点(例如设置信息增益阀值)。使用信息增益的话其实是有一个缺点,那就是它偏向于具有大量值的属性。就是说在训练集中,某个属性所取的不同值的个数越多,那么越有可能拿它来作为分裂属性,而这样做有时候是没有意义的,另外ID3不能处理连续分布的数据特征,于是就有了C4.5算法。CART算法也支持连续分布的数据特征。
算法步骤如下:
Python实现:
def chooseBestFeatureToSplitByID3(dataSet):
    '''
            选择最好的数据集划分方式
    :param dataSet:数据集
    :return: 划分结果
    '''
    numFeatures = len(dataSet[0]) - 1  # 最后一列yes分类标签,不属于特征向量
    baseEntropy = calcShannonEnt(dataSet)
    bestInfoGain = 0.0
    bestFeature = -1
    for i in range(numFeatures):  # 遍历所有特征
        infoGain = calcInformationGain(dataSet, baseEntropy, i)     # 计算信息增益
        if (infoGain > bestInfoGain):  # 选择最大的信息增益
            bestInfoGain = infoGain
            bestFeature = i
    return bestFeature  # 返回最优特征对应的维度

def majorityCnt(classList):
    '''
    采用多数表决的方法决定叶结点的分类
    :param: 所有的类标签列表
    :return: 出现次数最多的类
    '''
    classCount={}
    for vote in classList:                  # 统计所有类标签的频数
        if vote not in classCount.keys():
            classCount[vote] = 0
        classCount[vote] += 1
    sortedClassCount = sorted(classCount.iteritems(), key=operator.itemgetter(1), reverse=True) # 排序
    return sortedClassCount[0][0]

def createTree(dataSet,labels):
    '''
    创建决策树
    :param: dataSet:训练数据集
    :return: labels:所有的类标签
    '''
    classList = [example[-1] for example in dataSet]
    if classList.count(classList[0]) == len(classList):
        return classList[0]             # 第一个递归结束条件:所有的类标签完全相同
    if len(dataSet[0]) == 1:
        return majorityCnt(classList)   # 第二个递归结束条件:用完了所有特征
    bestFeat = chooseBestFeatureToSplitByID3(dataSet)   # 最优划分特征
    bestFeatLabel = labels[bestFeat]
    myTree = {bestFeatLabel:{}}         # 使用字典类型储存树的信息
    del(labels[bestFeat])
    featValues = [example[bestFeat] for example in dataSet]
    uniqueVals = set(featValues)
    for value in uniqueVals:
        subLabels = labels[:]       # 复制所有类标签,保证每次递归调用时不改变原始列表的内容
        myTree[bestFeatLabel][value] = createTree(splitDataSet(dataSet, bestFeat, value),subLabels)
    return myTree
- 1
- 2
- 3
- 4
- 5
- 6
- 7
- 8
- 9
- 10
- 11
- 12
- 13
- 14
- 15
- 16
- 17
- 18
- 19
- 20
- 21
- 22
- 23
- 24
- 25
- 26
- 27
- 28
- 29
- 30
- 31
- 32
- 33
- 34
- 35
- 36
- 37
- 38
- 39
- 40
- 41
- 42
- 43
- 44
- 45
- 46
- 47
- 48
- 49
- 50
- 51
- 52
这里使用Python语言的字典类型存储树的信息,简单方便。当然也可以定义一个新的数据结构存储树。
2.可视化
程序如下:
import matplotlib.pyplot as plt
import tree
# 定义文本框和箭头格式
decisionNode = dict(boxstyle="round4", color='#3366FF')  # 定义判断结点形态
leafNode = dict(boxstyle="circle", color='#FF6633')  # 定义叶结点形态
arrow_args = dict(arrowstyle="<-", color='g')  # 定义箭头

#计算叶结点数
def getNumLeafs(myTree):
    numLeafs = 0
    firstStr = list(myTree.keys())[0]
    secondDict = myTree[firstStr]
    for key in secondDict.keys():
        if type(secondDict[key]).__name__=='dict':# 测试结点的数据类型是否为字典
            numLeafs += getNumLeafs(secondDict[key])
        else:   numLeafs +=1
    return numLeafs

# 计算树的深度
def getTreeDepth(myTree):
    maxDepth = 0
    firstStr = list(myTree.keys())[0]
    secondDict = myTree[firstStr]
    for key in secondDict.keys():
        if type(secondDict[key]).__name__=='dict':# 测试结点的数据类型是否为字典
            thisDepth = 1 + getTreeDepth(secondDict[key])
        else:   thisDepth = 1
        if thisDepth > maxDepth: maxDepth = thisDepth
    return maxDepth

# 绘制带箭头的注释
def plotNode(nodeTxt, centerPt, parentPt, nodeType):
    createPlot.ax1.annotate(nodeTxt, xy=parentPt,  xycoords='axes fraction',
             xytext=centerPt, textcoords='axes fraction',
             va="center", ha="center", bbox=nodeType, arrowprops=arrow_args )

# 在父子结点间填充文本信息
def plotMidText(cntrPt, parentPt, txtString):
    xMid = (parentPt[0]-cntrPt[0])/2.0 + cntrPt[0]
    yMid = (parentPt[1]-cntrPt[1])/2.0 + cntrPt[1]
    createPlot.ax1.text(xMid, yMid, txtString, va="center", ha="center", rotation=30)

def plotTree(myTree, parentPt, nodeTxt):
    numLeafs = getNumLeafs(myTree)  # 计算宽与高
    depth = getTreeDepth(myTree)
    firstStr = list(myTree.keys())[0]
    cntrPt = (plotTree.xOff + (1.0 + float(numLeafs))/2.0/plotTree.totalW, plotTree.yOff)
    plotMidText(cntrPt, parentPt, nodeTxt)
    plotNode(firstStr, cntrPt, parentPt, decisionNode)  # 标记子结点属性值
    secondDict = myTree[firstStr]
    plotTree.yOff = plotTree.yOff - 1.0/plotTree.totalD # 减少y偏移
    for key in secondDict.keys():
        if type(secondDict[key]).__name__=='dict':
            plotTree(secondDict[key],cntrPt,str(key))        #recursion
        else:   #it's a leaf node print the leaf node
            plotTree.xOff = plotTree.xOff + 1.0/plotTree.totalW
            plotNode(secondDict[key], (plotTree.xOff, plotTree.yOff), cntrPt, leafNode)
            plotMidText((plotTree.xOff, plotTree.yOff), cntrPt, str(key))
    plotTree.yOff = plotTree.yOff + 1.0/plotTree.totalD
#if you do get a dictonary you know it's a tree, and the first element will be another dict

def createPlot(inTree):
    fig = plt.figure(1, facecolor='white')
    fig.clf()
    axprops = dict(xticks=[], yticks=[])
    createPlot.ax1 = plt.subplot(111, frameon=False, **axprops)
    plotTree.totalW = float(getNumLeafs(inTree))
    plotTree.totalD = float(getTreeDepth(inTree))
    plotTree.xOff = -0.5/plotTree.totalW; plotTree.yOff = 1.0;
    plotTree(inTree, (0.5,1.0), '')
    plt.show()
- 1
- 2
- 3
- 4
- 5
- 6
- 7
- 8
- 9
- 10
- 11
- 12
- 13
- 14
- 15
- 16
- 17
- 18
- 19
- 20
- 21
- 22
- 23
- 24
- 25
- 26
- 27
- 28
- 29
- 30
- 31
- 32
- 33
- 34
- 35
- 36
- 37
- 38
- 39
- 40
- 41
- 42
- 43
- 44
- 45
- 46
- 47
- 48
- 49
- 50
- 51
- 52
- 53
- 54
- 55
- 56
- 57
- 58
- 59
- 60
- 61
- 62
- 63
- 64
- 65
- 66
- 67
- 68
- 69
- 70
- 71
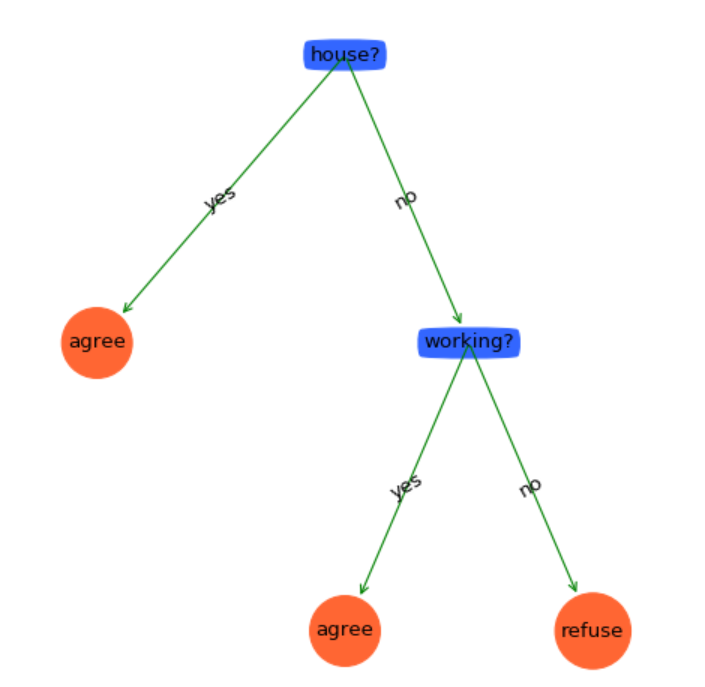
我们使用贷款申请样本数据表作为测试(使用找对象数据也没问题,反正随自己编):
# 导入数据
def createDataSet():
    dataSet = [['youth', 'no', 'no', 1, 'refuse'],
               ['youth', 'no', 'no', '2', 'refuse'],
               ['youth', 'yes', 'no', '2', 'agree'],
               ['youth', 'yes', 'yes', 1, 'agree'],
               ['youth', 'no', 'no', 1, 'refuse'],
               ['mid', 'no', 'no', 1, 'refuse'],
               ['mid', 'no', 'no', '2', 'refuse'],
               ['mid', 'yes', 'yes', '2', 'agree'],
               ['mid', 'no', 'yes', '3', 'agree'],
               ['mid', 'no', 'yes', '3', 'agree'],
               ['elder', 'no', 'yes', '3', 'agree'],
               ['elder', 'no', 'yes', '2', 'agree'],
               ['elder', 'yes', 'no', '2', 'agree'],
               ['elder', 'yes', 'no', '3', 'agree'],
               ['elder', 'no', 'no', 1, 'refuse'],
               ]
    labels = ['age', 'working?', 'house?', 'credit_situation']
    return dataSet, labels
# 测试代码
if __name__ == "__main__":
    myDat, labels = tree.createDataSet()
    myTree = tree.createTree(myDat, labels)
    print(myTree)
    createPlot(myTree)
- 1
- 2
- 3
- 4
- 5
- 6
- 7
- 8
- 9
- 10
- 11
- 12
- 13
- 14
- 15
- 16
- 17
- 18
- 19
- 20
- 21
- 22
- 23
- 24
- 25
- 26
绘图效果如下:
3.C4.5算法
C4.5算法用信息增益率来选择属性,继承了ID3算法的优点。并在以下几方面对ID3算法进行了改进:
- 克服了用信息增益选择属性时偏向选择取值多的属性的不足;
- 在树构造过程中进行剪枝;
- 能够完成对连续属性的离散化处理;
- 能够对不完整数据进行处理。
C4.5算法产生的分类规则易于理解、准确率较高;但效率低,因树构造过程中,需要对数据集进行多次的顺序扫描和排序。也是因为必须多次数据集扫描,C4.5只适合于能够驻留于内存的数据集。在实现过程中,C4.5算法在结构与递归上与ID3完全相同,区别只在于选取决决策特征时的决策依据不同,二者都有贪心性质:即通过局部最优构造全局最优。以下是算法步骤: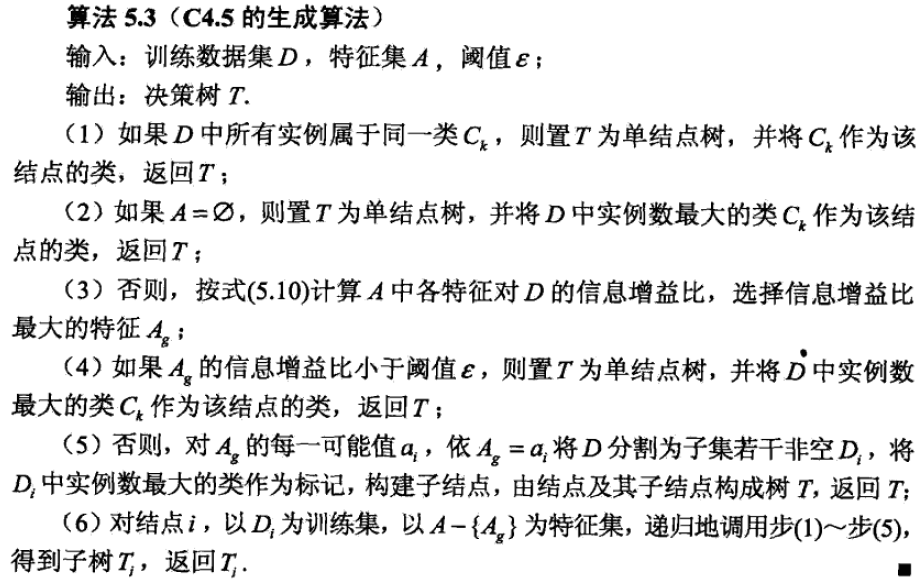
Python实现如下:
def chooseBestFeatureToSplitByC45(dataSet):
    '''
            选择最好的数据集划分方式
    :param dataSet:
    :return: 划分结果
    '''
    numFeatures = len(dataSet[0]) - 1  # 最后一列yes分类标签,不属于特征变量
    baseEntropy = calcShannonEnt(dataSet)
    bestInfoGainRate = 0.0
    bestFeature = -1
    for i in range(numFeatures):  # 遍历所有维度特征
        infoGainRate = calcInformationGainRatio(dataSet, baseEntropy, i)    # 计算信息增益比
        if (infoGainRate > bestInfoGainRate):  # 选择最大的信息增益比
            bestInfoGainRate = infoGainRate
            bestFeature = i
    return bestFeature  # 返回最佳特征对应的维度
- 1
- 2
- 3
- 4
- 5
- 6
- 7
- 8
- 9
- 10
- 11
- 12
- 13
- 14
- 15
- 16
其他部分都相同,只是改变一下调用选择特征的函数。画出来的决策树并没有变化:

5.执行分类
构造了决策树之后,我们就可以将它用于实际数据的分类,在执行分类时,需要输入决策树和用于构造树的所有类标签向量。然后,程序比较测试数据与决策树上的数值,递归执行该过程直到进入叶结点;最后将测试数据定义为叶结点所属的类型。Python实现如下:
def classify(inputTree,featLabels,testVec):
    '''
           利用决策树进行分类
    :param: inputTree:构造好的决策树模型
    :param: featLabels:所有的类标签
    :param: testVec:测试数据
    :return: 分类决策结果
    '''
    firstStr = inputTree.keys()[0]
    secondDict = inputTree[firstStr]
    featIndex = featLabels.index(firstStr)
    key = testVec[featIndex]
    valueOfFeat = secondDict[key]
    if isinstance(valueOfFeat, dict):
        classLabel = classify(valueOfFeat, featLabels, testVec)
    else: classLabel = valueOfFeat
    return classLabel
- 1
- 2
- 3
- 4
- 5
- 6
- 7
- 8
- 9
- 10
- 11
- 12
- 13
- 14
- 15
- 16
- 17
测试实例如下:

下一篇博文将会继续讲述使用CART算法生成决策树以及决策树的剪枝处理。
("#btn-readmore"); if(btnReadmore.length>0){ var winH = ("div.article_content"); var artH = articleBox.height(); if(artH > winH*2){ articleBox.css({ 'height':winH*2+'px', 'overflow':'hidden' }) btnReadmore.click(function(){ articleBox.removeAttr("style"); $(this).parent().remove(); }) }else{ btnReadmore.parent().remove(); } } })()
决策树 (Decision Tree) 原理简述及相关算法(ID3,C4.5)
Decision Tree 决策树:
决策树是属于机器学习监督学习分类算法中比较简单的一种,决策树是一个预测模型;他代表的是对象属性与对象值之间的一种映射关系。树中每个节点表示某个对象,而每个分叉路…
数据挖掘十大算法之决策树详解(1)

机器学习实战之决策树 - CSDN博客
花了差不多一个星期,终于把《机器学习实战》这本书的第三章的决策树过了一遍,对于一个python渣渣来说,确实是着实不容易,好多代码都得一个一个的去…
2018-6-2
机器学习之决策树(机器学习技法) - CSDN博客
决策树决策树在集成学习中的地位整个集成学习会按照是否有线程的小的模型(g)分为两种。如果我们有g的话我们就会用blending。如果想一边学习g一边融合模型就会用到…
2018-5-23
<div class="recommend-item-box" data-track-view="{"mod":"popu_614","con":",https://blog.csdn.net/xuelangwin/article/details/78831200,BlogCommendFromBaidu_0"}" data-track-click="{"mod":"popu_614","con":",https://blog.csdn.net/xuelangwin/article/details/78831200,BlogCommendFromBaidu_0"}">
<h4 class="text-truncate">
<a href="https://blog.csdn.net/xuelangwin/article/details/78831200" target="_blank">
<em>决策树</em> </a>
</h4>
<p class="content">
<a href="https://blog.csdn.net/xuelangwin/article/details/78831200" target="_blank">
1、决策树,是一种分类算法和回归算法(这里只介绍分类算法)
2、决策树算法的构建分为3个部分:特征的选择,决策树的生成,决策树的剪枝;(主要参考李航的《统计学习方法》第五章)
a、特征的选…
机器学习之决策树 - CSDN博客
由于这种决策分支画成图形很像一棵树的枝干,故称决策树。在机器学习中,决策树是一个预测模型,他代表的是对象属性与对象值之间的一种映射关系。 决策树是一种…
2018-7-5
机器学习决策树
coursera华盛顿大学机器学习专项课程第三门课第三周代码和数据,习题答案
2018-6-26
决策树–从原理到实现
3.1 决策树的基本思想
实例:销售调查例子(对潜在客户进行分类,给出销售人员指导意见)
销售调查表:
销售调查决策树:
上面仅是从定性的角度对潜在用户的判断,下面加上定量的判断:
决策…
机器学习之决策树 - CSDN博客
决策树概述因变量为类别分类树 ID3以及ID45算法 cart算法因变量为连续值回归树 cart算法决策树概述决策树相当于if-then的感觉,从树的根节点出发,进行判断。其中非…
2018-5-22
机器学习(决策树)
举报人: 被举报人: zx10212029 举报的资源分: 3 类型: 详细原因: 取 消 提 交 机器学习(决策树) 3积分 立即下载 …
2018-5-8
决策树分类
机器学习(周志华)——决策树 - CSDN博客
这篇决策树的笔记看了周志华的《机器学习》的决策树相关章节,同时也参照了一些博客才完成的。下面是参照的博客链接:http://www.cnblogs.com/pinard/p/6053344….
2018-6-29
机器学习-周志华-课后习题答案-决策树 - CSDN博客
机器学习-周志华-个人练习4.3 4.3 试编程实现基于信息熵进行划分选择的决策树算法,并为表4.3中的数据生成一颗决策树。刚开始看到这一章时感觉这些内容都很好理解,…
2018-5-22
var width = $("div.recommend-box").outerWidth() - 48;
NEWS_FEED({
w: width,
h: 90,
showid: 'Afihld',
placeholderId: 'a_d_feed_0',
inject: 'define',
define: {
imagePosition: 'left',
imageBorderRadius: 0,
imageWidth: 120,
imageHeight: 90,
imageFill: 'clip',
displayImage: true,
displayTitle: true,
titleFontSize: 20,
titleFontColor: '#333',
titleFontFamily: 'Microsoft Yahei',
titleFontWeight: 'bold',
titlePaddingTop: 0,
titlePaddingRight: 0,
titlePaddingBottom: 10,
titlePaddingLeft: 16,
displayDesc: true,
descFontSize: 14,
descPaddingLeft: 14,
descFontColor: '#6b6b6b',
descFontFamily: 'Microsoft Yahei',
paddingTop: 0,
paddingRight: 0,
paddingBottom: 0,
paddingLeft: 0,
backgroundColor: '#fff',
hoverColor: '#ca0c16'
}
})
从决策树学习谈到贝叶斯分类算法、EM、HMM
第一篇:从决策树学习谈到贝叶斯分类算法、EM、HMM (Machine Learning & Data Mining交流群:8986884)引言 …
什么是决策树算法
咱们直接切入正题。所谓决策树,顾名思义,是一种树,一种依托于策略抉择而建立起来的树。
机器学习中,决策树是一个预测模型;他代表的是对象属性与对象值之间…
机器学习算法总结–决策树 - CSDN博客
决策树学习通常包括3个步骤:特征选择、决策树的生成和决策树的修剪。 决策树学习本质上是从训练数据集中归纳出一组分类规则,也可以说是由训练数据集估计条件概率模型…
2018-6-10
机器学习—决策树 - CSDN博客
原Bolg:http://blog.csdn.net/zx10212029/article/details/49529843 Decision tree 决策树是机器学习中一种基本的分类和回归算法,是依托于策略抉择而建立起来的树。…
2018-3-14
机器学习经典算法详解及Python实现–决策树(Decision Tree)
机器学习方法(四):决策树Decision Tree原理与实现技巧
<div class="recommend-item-box" data-track-view="{"mod":"popu_614","con":",https://blog.csdn.net/csqazwsxedc/article/details/65697652,BlogCommendFromBaidu_16"}" data-track-click="{"mod":"popu_614","con":",https://blog.csdn.net/csqazwsxedc/article/details/65697652,BlogCommendFromBaidu_16"}">
<h4 class="text-truncate">
<a href="https://blog.csdn.net/csqazwsxedc/article/details/65697652" target="_blank">
<em>决策树</em>原理实例(python代码实现) </a>
</h4>
<p class="content">
<a href="https://blog.csdn.net/csqazwsxedc/article/details/65697652" target="_blank">
决策数(Decision Tree)在机器学习中也是比较常见的一种算法,属于监督学习中的一种。看字面意思应该也比较容易理解,相比其他算法比如支持向量机(SVM)或神经网络,似乎决策树感觉“亲切”许多。... </a>
</p>
<div class="info-box d-flex align-content-center">
<p>
<a class="avatar" src="https://blog.csdn.net/csqazwsxedc" title="csqazwsxedc" target="_blank">
<img src="https://avatar.csdn.net/C/D/5/3_csqazwsxedc.jpg" alt="csqazwsxedc" class="avatar-pic">
<span class="name">csqazwsxedc</span>
</a>
</p>
<p>
<span class="date">2017-03-26 23:04:13</span>
</p>
<p>
<span class="read-num">阅读数:12737</span>
</p>
</div>
</div>
<div class="recommend-item-box" data-track-view="{"mod":"popu_614","con":",https://blog.csdn.net/Katherine_hsr/article/details/79382249,BlogCommendFromBaidu_17"}" data-track-click="{"mod":"popu_614","con":",https://blog.csdn.net/Katherine_hsr/article/details/79382249,BlogCommendFromBaidu_17"}">
<h4 class="text-truncate">
<a href="https://blog.csdn.net/Katherine_hsr/article/details/79382249" target="_blank">
常见的六大聚类算法 </a>
</h4>
<p class="content">
<a href="https://blog.csdn.net/Katherine_hsr/article/details/79382249" target="_blank">
1. K-Means(K均值)聚类
算法步骤:
(1) 首先我们选择一些类/组,并随机初始化它们各自的中心点。中心点是与每个数据点向量长度相同的位置。这需要我们提前预知类的数量(即中心点的数量)。…
Boosting算法
随机森林算法学习(RandomForest)
机器学习 —— Boosting算法
算法的三个要素
(1)函数模型:Boosting的函数模型是叠加型的,即F(x)=∑i=1kfi(x;θi)F(x)=∑i=1kfi(x;θi)F(x)=\su…
手把手生成决策树(dicision tree)
使用R完成决策树分类
对于随机森林的通俗理解
决策树之CART(分类回归树)详解
主要内容
CART分类回归树简介
CART分类回归树分裂属性的选择
CART分类回归树的剪枝
1、CART分类回归树简介
CART分类回归树是一…
决策树之剪枝原理与CART算法

前言:决策树(Decision Tree)是一种基本的分类与回归方法,本文主要讨论分类决策树。决策树模型呈树形结构,在分类问题中,表示基于特征对实例进行分类的过程。它可以认为是if-then规则的集合,也可以认为是定义在特征空间与类空间上的条件概率分布。相比朴素贝叶斯分类,决策树的优势在于构造过程不需要任何领域知识或参数设置,因此在实际应用中,对于探测式的知识发现,决策树更加适用。
报错信息最后一句:NameError: global name ‘operator’ is not defined
查看 18 条热评