Programming Exercise 7: K-means Clustering and Principal Component Analysis
K-Means聚类
findClosestCentroids
给出若干组数据点X,矩阵X每一行代表一组数据,以及K个聚类中心centroids,寻找距离每个点最近的聚类中心点,换言之:
\[\arg\ \min_{idx(1),\cdots,idx(m)}J(idx(1),\cdots,idx(m),\mu_1,\cdots,\mu_K)\]
\[=\frac 1 m \sum_{i=1}^m \|x^{(i)}-\mu_{idx(i)}\|^2\]
function idx = findClosestCentroids(X, centroids)
%FINDCLOSESTCENTROIDS computes the centroid memberships for every example
%   idx = FINDCLOSESTCENTROIDS (X, centroids) returns the closest centroids
%   in idx for a dataset X where each row is a single example. idx = m x 1
%   vector of centroid assignments (i.e. each entry in range [1..K])
%

% Set K
K = size(centroids, 1);

% You need to return the following variables correctly.
idx = zeros(size(X,1), 1);

% ====================== YOUR CODE HERE ======================
% Instructions: Go over every example, find its closest centroid, and store
%               the index inside idx at the appropriate location.
%               Concretely, idx(i) should contain the index of the centroid
%               closest to example i. Hence, it should be a value in the
%               range 1..K
%
% Note: You can use a for-loop over the examples to compute this.
%
    mindis=zeros(size(X,1),1);
    mindis(:)=1e9;
    idx(:)=0;
    for i=1:size(X,1)
        for j=1:K
            nowdis=(X(i,:)-centroids(j,:))*(X(i,:)-centroids(j,:))';
            if(nowdis<mindis(i))
                mindis(i)=nowdis;
                idx(i)=j;
            end
        end
    end
% =============================================================

end
computeCentroids
给出若干组数据点X,矩阵X每一行代表一组数据,以及K个聚类中心centroids,更新K个聚类中心点,使得代价函数最小,换言之:
\[\arg\ \min_{\mu_1,\cdots,\mu_K}J(idx(1),\cdots,idx(m),\mu_1,\cdots,\mu_K)\]
\[=\frac 1 m \sum_{i=1}^m \|x^{(i)}-\mu_{idx(i)}\|^2\]
\[\mu_t:=\frac {\sum_{idx(i)=t}x^{(i)}}{\sum_{idx(i)=t}1}\]
function centroids = computeCentroids(X, idx, K)
%COMPUTECENTROIDS returs the new centroids by computing the means of the
%data points assigned to each centroid.
%   centroids = COMPUTECENTROIDS(X, idx, K) returns the new centroids by
%   computing the means of the data points assigned to each centroid. It is
%   given a dataset X where each row is a single data point, a vector
%   idx of centroid assignments (i.e. each entry in range [1..K]) for each
%   example, and K, the number of centroids. You should return a matrix
%   centroids, where each row of centroids is the mean of the data points
%   assigned to it.
%

% Useful variables
[m n] = size(X);

% You need to return the following variables correctly.
centroids = zeros(K, n);


% ====================== YOUR CODE HERE ======================
% Instructions: Go over every centroid and compute mean of all points that
%               belong to it. Concretely, the row vector centroids(i, :)
%               should contain the mean of the data points assigned to
%               centroid i.
%
% Note: You can use a for-loop over the centroids to compute this.
%
    cluster_num=zeros(K,1); %cluster_num(i)=the point number of the ith cluster
    for i=1:size(X,1)
        centroids(idx(i),:)=centroids(idx(i),:)+X(i,:);
        cluster_num(idx(i))=cluster_num(idx(i))+1;
    end
    for i=1:K
        centroids(i,:)=centroids(i,:)/cluster_num(i);
    end
% =============================================================


end
kMeansInitCentroids
随机从所有数据点中选K个点作为初始聚类中心点,具体看代码
function centroids = kMeansInitCentroids(X, K)
%KMEANSINITCENTROIDS This function initializes K centroids that are to be
%used in K-Means on the dataset X
%   centroids = KMEANSINITCENTROIDS(X, K) returns K initial centroids to be
%   used with the K-Means on the dataset X
%

% You should return this values correctly
centroids = zeros(K, size(X, 2));

% ====================== YOUR CODE HERE ======================
% Instructions: You should set centroids to randomly chosen examples from
%               the dataset X
%
    idx=randperm(size(X,1));
    centroids=X(idx(1:K),:);
% =============================================================

end
最终测试结果
Fig 1. K-Means聚类10次迭代过程中,3个聚类中心的变化路径
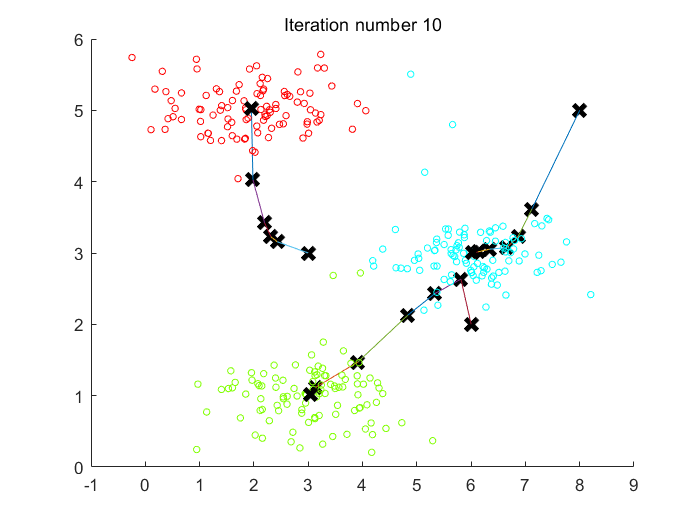
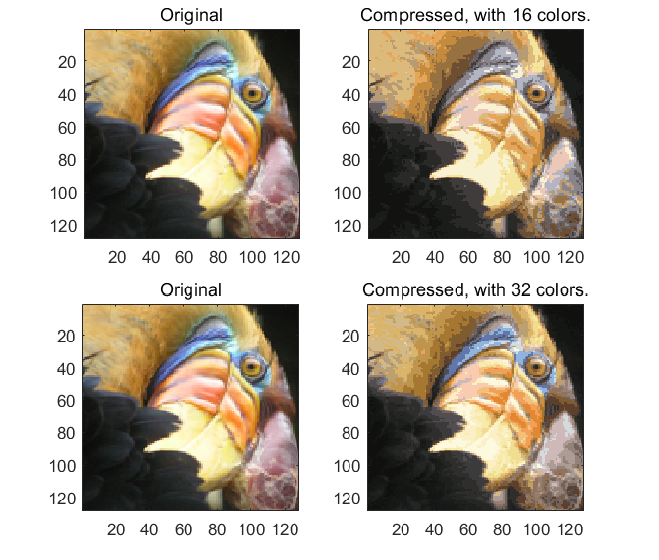
Fig 2.保留16色、32色后压缩得到的图片