TensorBoard是TensorFlow自带的神经网络可视化工具,用直观的流程图显示神经网络,更好的理解学习。
与 tensorboard 兼容的浏览器是 “Google Chrome”.
定义网络
inputs
# 定义输入inputs
with tf.name_scope('inputs'):
    # 定义inputs中的x_input,y_input
    xs = tf.placeholder(tf.float32, [None, 1], name='x_input')
    ys = tf.placeholder(tf.float32, [None, 1], name='y_input')1234512345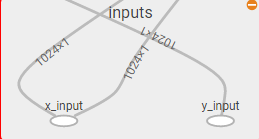
layer
添加layer的函数add_layer()
def add_layer(inputs, in_size, out_size, activation_function=None):
    # 添加layer的函数
    with tf.name_scope('layer'):
        with tf.name_scope('weights'):
            Weights = tf.Variable(tf.random_normal([in_size, out_size]), name='W')
        with tf.name_scope('biases'):
            biases = tf.Variable(tf.zeros([1, out_size]) + 0.1, name='b')
        with tf.name_scope('Wx_plus_b'):
            Wx_plus_b = tf.add(tf.matmul(inputs, Weights), biases)

        if activation_function is None:
            outputs = Wx_plus_b
        else:
            outputs = activation_function(Wx_plus_b, )
        return outputs123456789101112131415123456789101112131415
添加中间层l1
l1 = add_layer(xs, 1, 10, activation_function=tf.nn.relu)11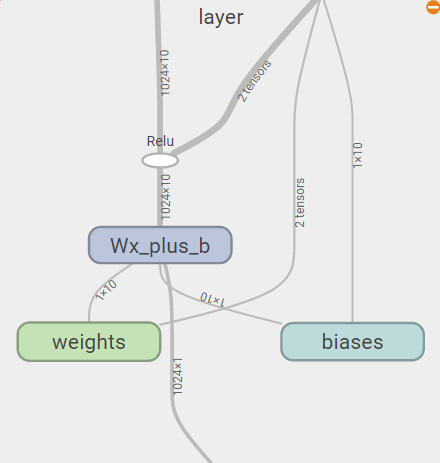
添加输出层prediction
prediction = add_layer(l1, 10, 1, activation_function=None)11loss
# 计算真实数据和预测的误差
with tf.name_scope('loss'):
    loss = tf.reduce_mean(tf.reduce_sum(tf.square(ys - prediction),
                                        reduction_indices=[1]))12341234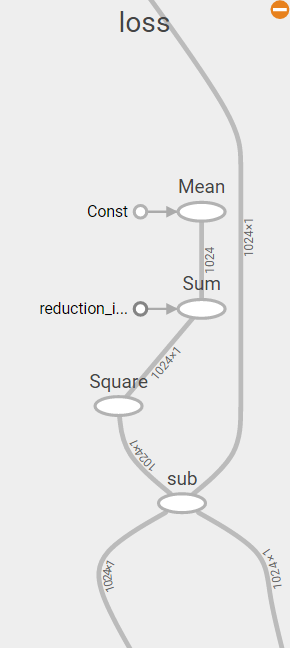
train
# train使用梯度下降最小化损失loss
with tf.name_scope('train'):
    train_step = tf.train.GradientDescentOptimizer(0.1).minimize(loss)123123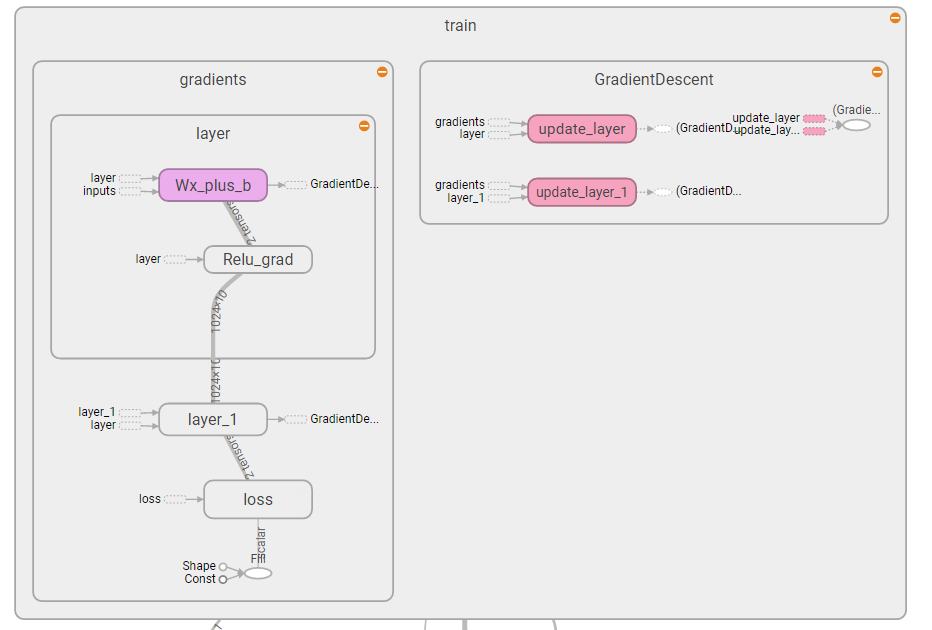
将sess.graph写入到图中,方便
# 获得Session
sess = tf.Session()
# 将sess.graph写入到图中
writer = tf.summary.FileWriter("logs/", sess.graph)
# 初始化
init = tf.global_variables_initializer()
# 跑起来
sess.run(init)1234567812345678
for i in range(1000):
# 每一步放入数据训练。
sess.run(train_step, feed_dict={xs: x_data, ys: y_data})
if i % 50 == 0:
# 每50记录所有的summary
result = sess.run(merged,
feed_dict={xs: x_data, ys: y_data})
writer.add_summary(result, i)1234567812345678对于Linux和mac os:
扫描二维码关注公众号,回复:
1846976 查看本文章

# direct to the local dir and run this in terminal:
# $ tensorboard --logdir='logs'1212
对于windows,必须填写完整的路径,并且不要加”,摸索了半天/(ㄒoㄒ)/~~:
# direct to the local dir and run this in terminal:
# $ tensorboard --logdir=dir
# 例如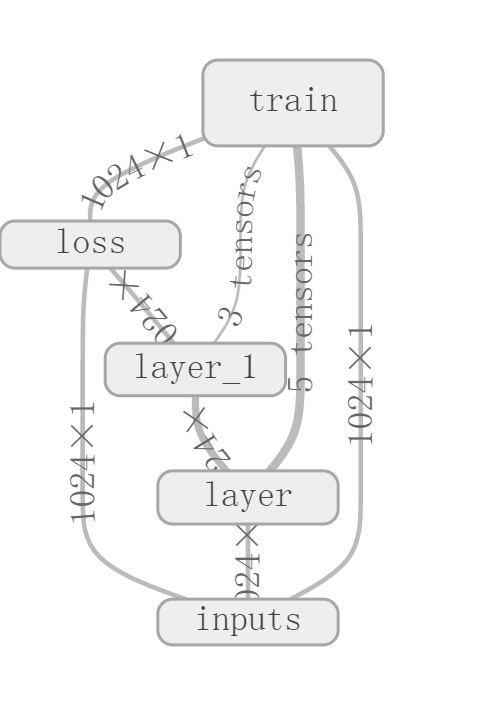
tensorboard --logdir=D:\project\python3code\mofan\logs12341234然后使用Chrome中,输入http://localhost:6006,然后切换到GRAPHS就可以看到定义的图了。
总体结构图:
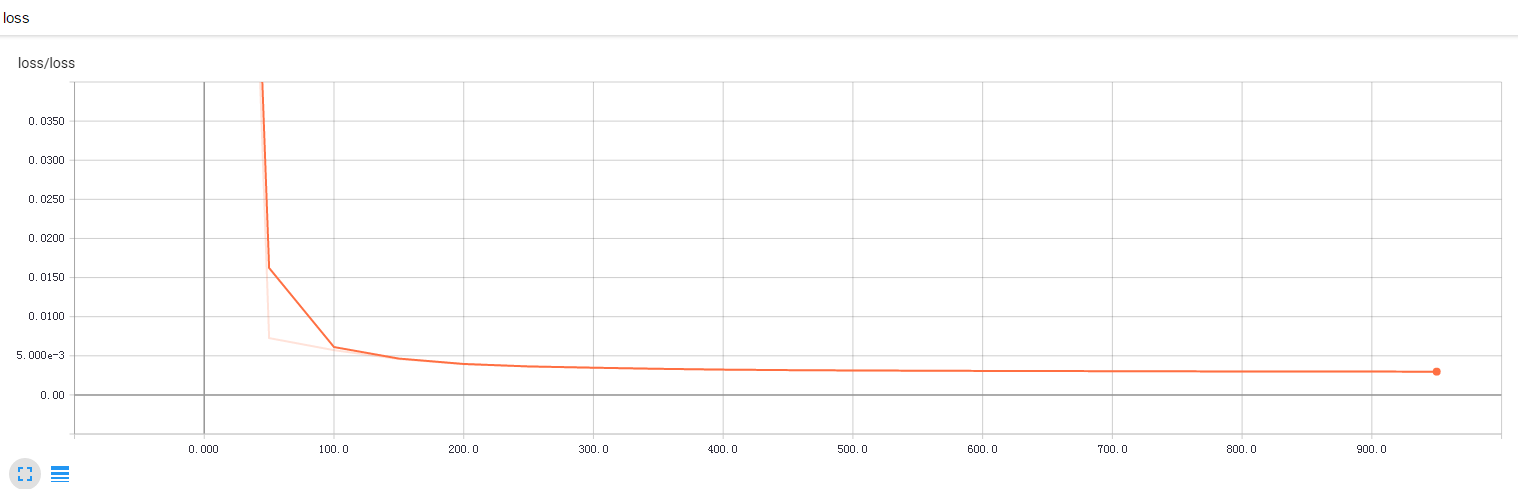
训练中loss下降曲线:
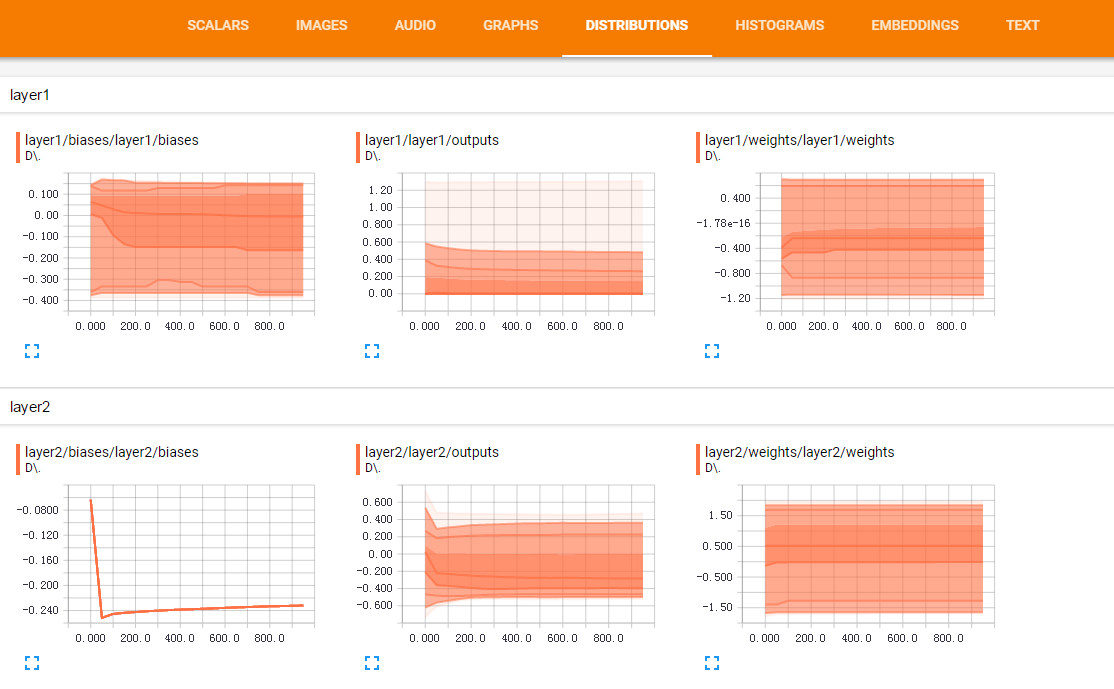
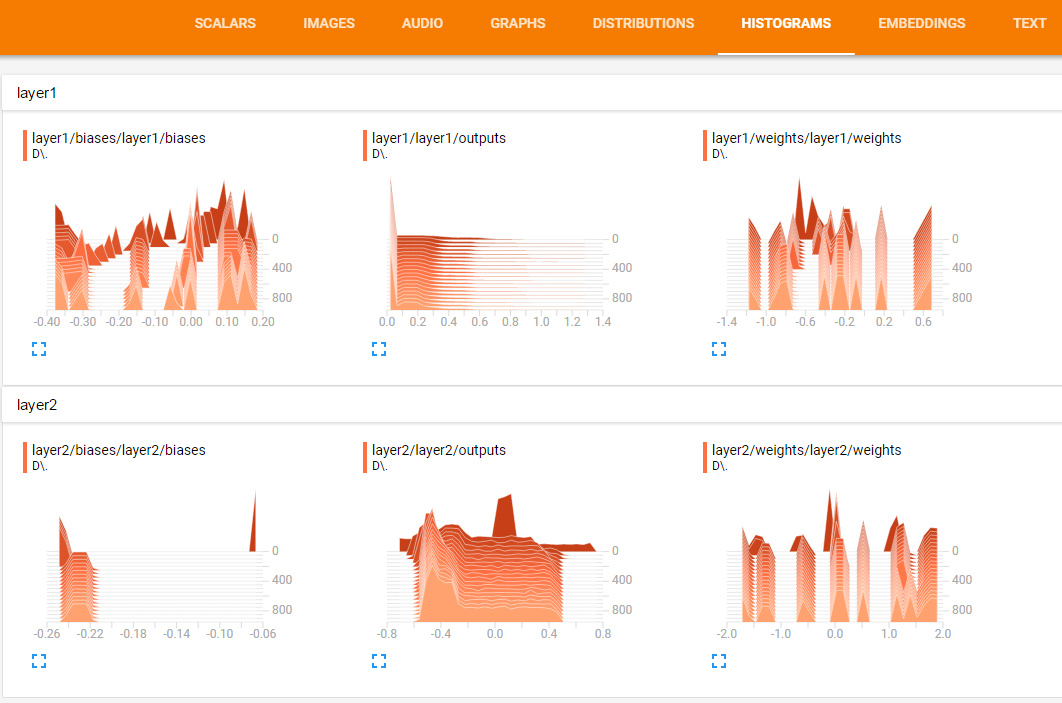
训练中layer的权重和biases变化情况。(表征其值的概率分布)
训练中layer的变化:
完整代码:tensorboard1.py