http://training.data-artisans.com/是Apache Flink商业公司DataArtisans提供的一个flink学习平台,主要提供了一些业务场景和flink api结合的case。本文摘取其中一个计算出租车上/下客人热点区域demo进行分析。
一 数据准备
flink-traing的大部分例子是以New York City Taxi & Limousine Commission 提供的一份历史数据集作为练习数据源,其中最常用一种类型为taxi ride的事件定义为
rideId         : Long      // a unique id for each ride
taxiId         : Long      // a unique id for each taxi
driverId       : Long      // a unique id for each driver
isStart        : Boolean   // TRUE for ride start events, FALSE for ride end events
startTime      : DateTime  // the start time of a ride
endTime        : DateTime  // the end time of a ride,
                           //   "1970-01-01 00:00:00" for start events
startLon       : Float     // the longitude of the ride start location
startLat       : Float     // the latitude of the ride start location
endLon         : Float     // the longitude of the ride end location
endLat         : Float     // the latitude of the ride end location
passengerCnt   : Short     // number of passengers on the ride
下载数据集
wget http://training.data-artisans.com/trainingData/nycTaxiRides.gz
将数据源转化为flink stream source数据
// get an ExecutionEnvironment
StreamExecutionEnvironment env =
  StreamExecutionEnvironment.getExecutionEnvironment();
// configure event-time processing
env.setStreamTimeCharacteristic(TimeCharacteristic.EventTime);

// get the taxi ride data stream
DataStream<TaxiRide> rides = env.addSource(
  new TaxiRideSource("/path/to/nycTaxiRides.gz", maxDelay, servingSpeed));
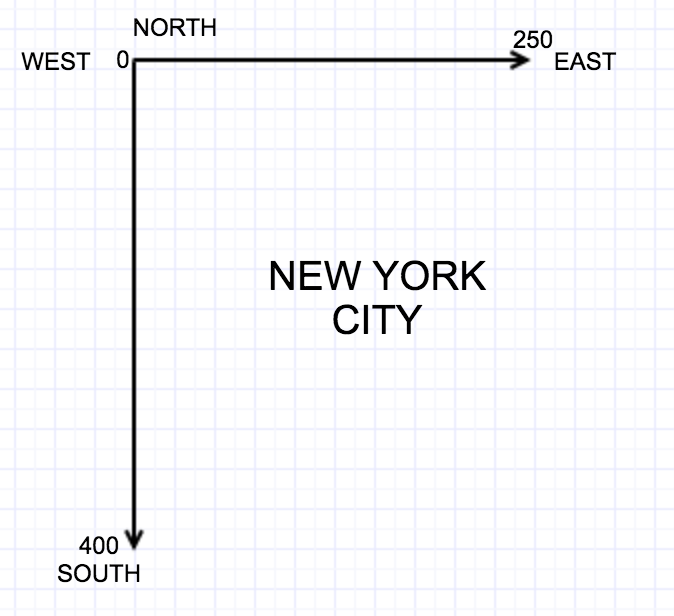
二 坐标分格
如下图所示,程序将整个城市坐标由西北向东南划分为大约250X400个单位的单元格
三 根据单元格计算坐标值
基础坐标数据
    // geo boundaries of the area of NYC
    public static double LON_EAST = -73.7;
    public static double LON_WEST = -74.05;
    public static double LAT_NORTH = 41.0;
    public static double LAT_SOUTH = 40.5;

    // area width and height
    public static double LON_WIDTH = 74.05 - 73.7;
    public static double LAT_HEIGHT = 41.0 - 40.5;

    // delta step to create artificial grid overlay of NYC
    public static double DELTA_LON = 0.0014;
    public static double DELTA_LAT = 0.00125;

    // ( |LON_WEST| - |LON_EAST| ) / DELTA_LON
    public static int NUMBER_OF_GRID_X = 250;
    // ( LAT_NORTH - LAT_SOUTH ) / DELTA_LAT
    public static int NUMBER_OF_GRID_Y = 400;
根据经纬度计算单元格唯一id
    public static int mapToGridCell(float lon, float lat) {
        int xIndex = (int)Math.floor((Math.abs(LON_WEST) - Math.abs(lon)) / DELTA_LON);
        int yIndex = (int)Math.floor((LAT_NORTH - lat) / DELTA_LAT);

        return xIndex + (yIndex * NUMBER_OF_GRID_X);
    }
四 程序实现
将坐标映射到gridId之后剩下的就是采用窗口统计单位时间内event事件超过一定阈值的grid。
// find popular places
        DataStream<Tuple5<Float, Float, Long, Boolean, Integer>> popularSpots = rides
                // remove all rides which are not within NYC
                .filter(new RideCleansing.NYCFilter())
                // match ride to grid cell and event type (start or end)
                .map(new GridCellMatcher())
                // partition by cell id and event type
                .<KeyedStream<Tuple2<Integer, Boolean>, Tuple2<Integer, Boolean>>>keyBy(0, 1)
                // build sliding window
                .timeWindow(Time.minutes(15), Time.minutes(5))
                // count ride events in window
                .apply(new RideCounter())
                // filter by popularity threshold
                .filter((Tuple4<Integer, Long, Boolean, Integer> count) -> (count.f3 >= popThreshold))
                // map grid cell to coordinates
                .map(new GridToCoordinates());

        // print result on stdout
        popularSpots.print();
上述flink job在统计完热点区域后又将gridId映射回每个单元格的中心点经纬度,具体实现为:
    /**
     * Maps the grid cell id back to longitude and latitude coordinates.
     */
    public static class GridToCoordinates implements
            MapFunction<Tuple4<Integer, Long, Boolean, Integer>, Tuple5<Float, Float, Long, Boolean, Integer>> {

        @Override
        public Tuple5<Float, Float, Long, Boolean, Integer> map(
                Tuple4<Integer, Long, Boolean, Integer> cellCount) throws Exception {

            return new Tuple5<>(
                    GeoUtils.getGridCellCenterLon(cellCount.f0),
                    GeoUtils.getGridCellCenterLat(cellCount.f0),
                    cellCount.f1,
                    cellCount.f2,
                    cellCount.f3);
        }
    }


    /**
     * Returns the longitude of the center of a grid cell.
     *
     * @param gridCellId The grid cell.
     *
     * @return The longitude value of the cell's center.
     */
    public static float getGridCellCenterLon(int gridCellId) {

        int xIndex = gridCellId % NUMBER_OF_GRID_X;

        return (float)(Math.abs(LON_WEST) - (xIndex * DELTA_LON) - (DELTA_LON / 2)) * -1.0f;
    }

    /**
     * Returns the latitude of the center of a grid cell.
     *
     * @param gridCellId The grid cell.
     *
     * @return The latitude value of the cell's center.
     */
    public static float getGridCellCenterLat(int gridCellId) {

        int xIndex = gridCellId % NUMBER_OF_GRID_X;
        int yIndex = (gridCellId - xIndex) / NUMBER_OF_GRID_X;

        return (float)(LAT_NORTH - (yIndex * DELTA_LAT) - (DELTA_LAT / 2));

    }
结论: 综上所示,通过单元格划分,flink程序可以方便的解决实时统计热点地理区域这一类问题。
代码地址:https://github.com/dataArtisans/flink-training-exercises/blob/master/src/main/java/com/dataartisans/flinktraining/exercises/datastream_java/windows/PopularPlaces.java