OpenGL 性能指标
cocos2d-x 中有三个跟 OpenGL 相关的性能指标,游戏运行时显示在左下角;cocos2d-x 默认会显示这些性能指标,可以手动在代码在开启或关闭,C++ 项目在 AppDelegate 的 applicationDidFinishLaunching 函数中设置
Director::getInstance()->setDisplayStats(true);lua 项目在配置文件 config.lua 中设置
CC_SHOW_FPS = trueFPS(Frames Per Second)
fps 是帧率,顾名思义就是每秒绘制多少帧。帧率设置得超高,画面刷新得越频繁,游戏看起来更顺畅;但这也意味着每秒要做的运算更多,更加耗 CPU 或 GPU,而且如果运算量过大的话,可能会出现卡帧。一般游戏的帧率不会低于 30 帧,实时性要求比较高的场景可以设置成 60 帧。这个指标可以帮助我们查看游戏在什么时候计算量过大,然后降低计算量或分散计算到多个帧中去。GL Calls
gl call 是 opengl 渲染的次数,即每一帧调用 opengl 指令的次数。这个数字越小越好,优化的方向有- 使用 SpriteBatchNode 来批量处理
- 将小图片打包成合图,加载到 SpriteFrameCache 中
- 不可见的元素设置为不可见,而不是设置透明度为 0
使用 SpriteBatchNode 是 2.x 的做法,3.0 之后官方不建议使用。这种方式要求所有 Sprite 都要先添加到 SpriteBatchNode 上,虽然能提升效率,但有很多限制,而且某些情况下反而会降低效率。比如有 Sprite 在屏幕外时,SpriteBtachNode 并不会作检查,而是直接渲染所有的 Sprite;而直接使用 Sprite 的方式会判断 Sprite 是否在屏幕外,如果在屏幕外则不渲染。3.0 之后直接使用 Sprite 也可批量处理,只要多个 Sprite 使用同张纹理并且使用相同的着色器和混合函数(SpriteBatchNode 也有这些要求),所以推荐直接使用 Sprite 而不是 SpriteBatchNode。
使用 SpriteBatchNode
local batch = cc.SpriteBatchNode:create("popcap.png")
for i = 1, 10 do
    local sprite = cc.Sprite:create("popcap.png")
    batch:addChild(sprite)
end
self:addChild(batch)
batch:setPosition(cc.p(win_size.width / 2, win_size.height / 2))
直接使用 Sprite
for i = 1, 10 do
    self._icon=cc.Sprite:create("popcap.png")
    self._icon:setPosition(cc.p(win_size.width / 2, win_size.height / 2))
    self:addChild(self._icon)
end
两种情况的 gl call 都是 1
把图片事先加载到精灵帧缓冲区并不影响 gl call,只是创建精灵时会快一些而已;但把小图片打包成合图,再加载到精灵帧缓冲区,则可以降低 gl call。
直接使用 Sprite
for i = 1, 10 do
    self._icon=cc.Sprite:create("popcap.png")
    self._icon:setPosition(cc.p(win_size.width / 2, win_size.height / 2))
    self:addChild(self._icon)
end

for i = 1, 10 do
    self._icon=cc.Sprite:create("popcap2.png")
    self._icon:setPosition(cc.p(win_size.width / 2, win_size.height / 2))
    self:addChild(self._icon)
end
使用 SpriteFrameCache
local sf = sfc:getSpriteFrameByName("popcap.png")
for i = 1, 10 do
    self._icon = cc.Sprite:createWithSpriteFrame(sf)
    self._icon:setPosition(cc.p(win_size.width / 2, win_size.height / 2))
    self:addChild(self._icon)
end

sf = sfc:getSpriteFrameByName("popcap2.png")
for i = 1, 10 do
    self._icon = cc.Sprite:createWithSpriteFrame(sf)
    self._icon:setPosition(cc.p(win_size.width / 2, win_size.height / 2))
    self:addChild(self._icon)
end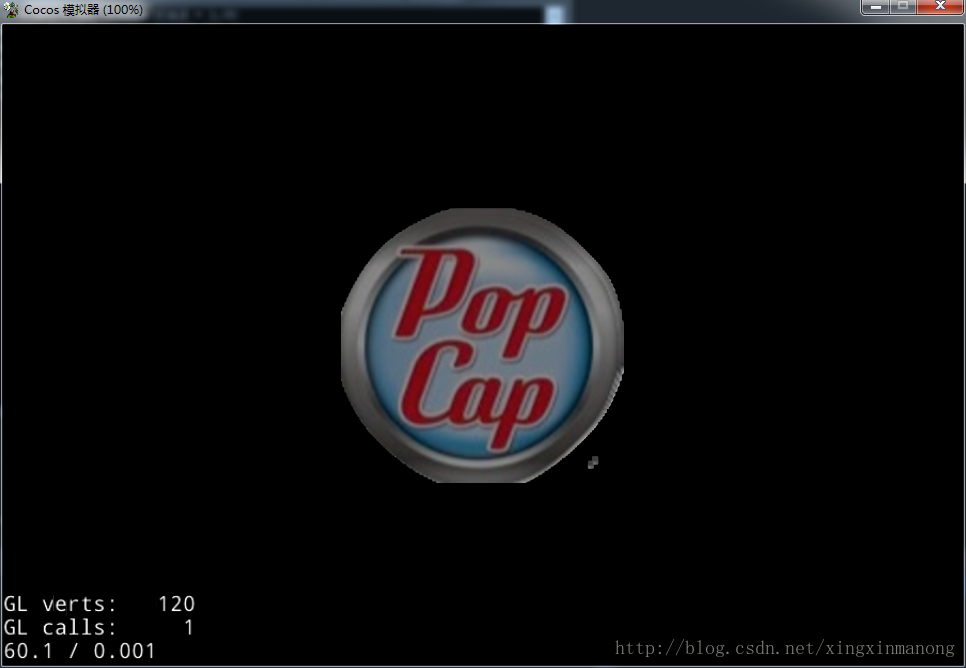
第二种方式因为 popcap.png 和 popcap2.png 在同一个合图里,所以创建二十个精灵只需要绘制一次;而第一种方式 popcap.png 和 popcap2.png 是两张不同的精灵,所以会绘制两次。
对于屏幕外或者被隐藏的 UI,将其 visible 设为 false,这样就不会绘制;如果设置透明度为 0,则还是会绘制。
self._icon = cc.Sprite:create("popcap.png")
self._icon:setPosition(cc.p(win_size.width / 2, win_size.height / 2))
self._icon:setOpacity(0)
self:addChild(self._icon)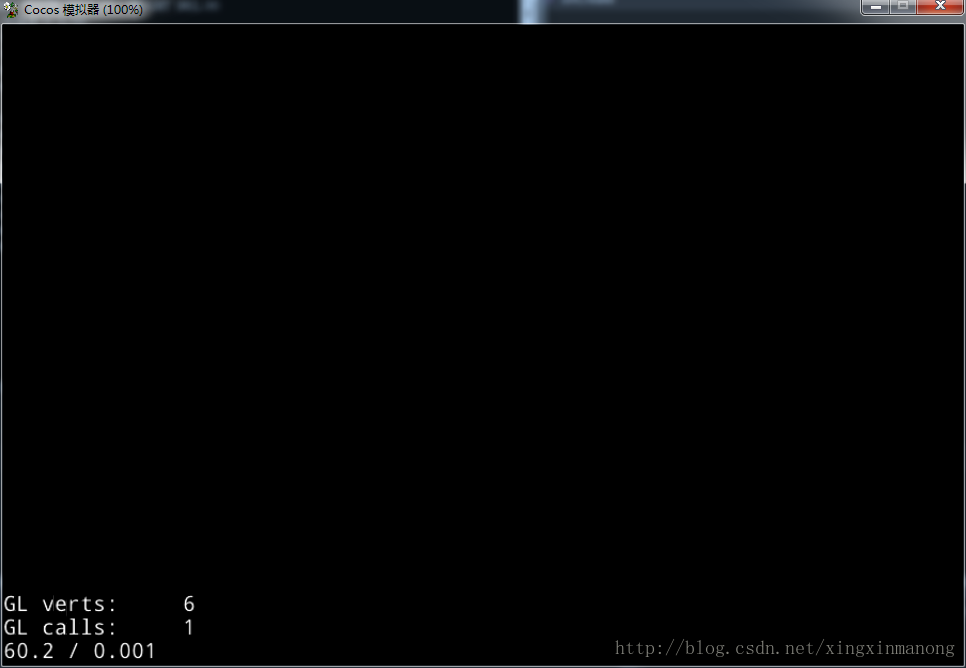
self._icon = cc.Sprite:create("popcap.png")
self._icon:setPosition(cc.p(win_size.width / 2, win_size.height / 2))
self._icon:setVisible(false)
self:addChild(self._icon)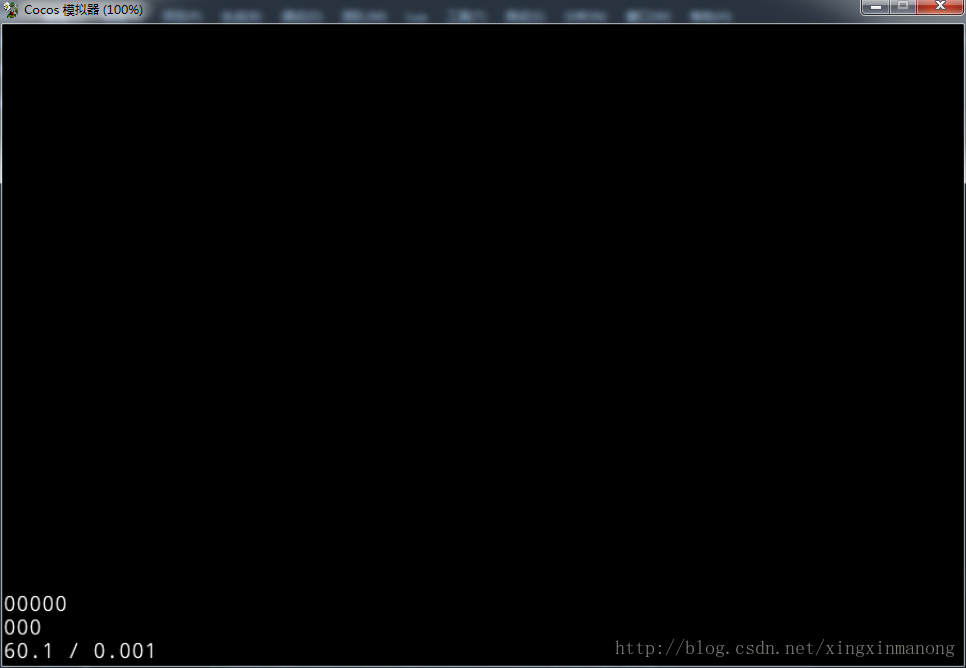
- GL Verts
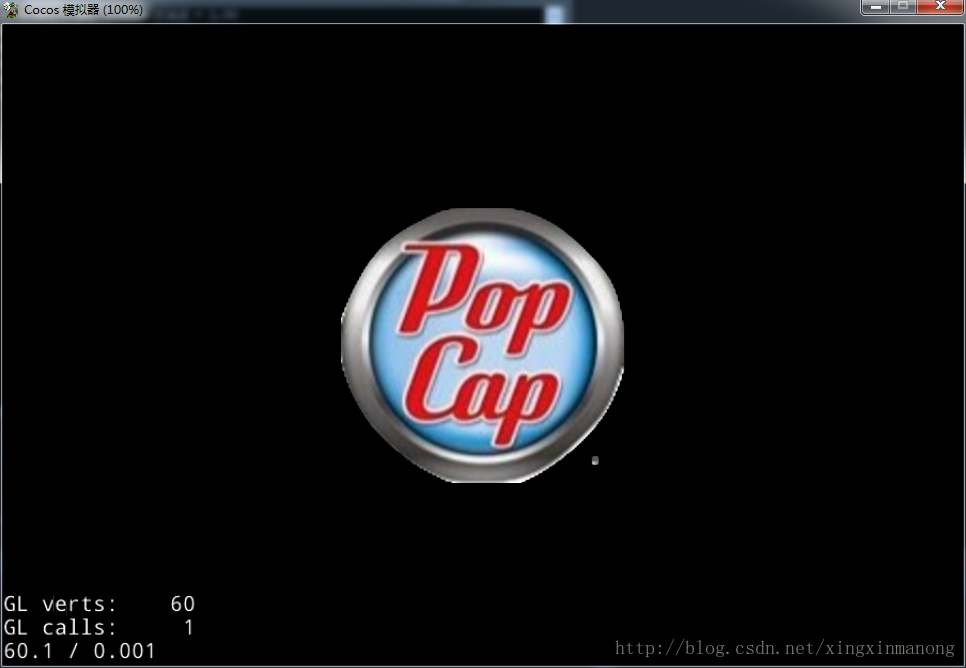
gl verts 是指发送给显卡的顶点数,这个数也是越小越好。顶点数直接与游戏的显示对象相关,一张矩形图片一般绘制 6 个顶点,像上面的例子创建 10 个 Sprite 的时候顶点数是 60,创建 20 个 Sprite 的时候顶点数是 120。使用 SpriteBatchNode 或 SpriteFrameCache 都不能降低顶点数,只能实现批量渲染,减少绘制次数,但该绘制多少精灵就得绘制多少精灵,即使这些精灵使用同样的贴图。降低顶点数的方法是将看不见的元素设为不可见,不是设置透明度为 0,这点和 gl call 一样,参见上面的例子执行结果。
总结
- 不使用 SpriteBatchNode
- 把小图打包成合图并加载到 SpriteFramecache
- 不需要的元素及时从显示列表移除
- 看不见的元素设置 visible 为 false
集成 android-ndk-profiler
首先,从 android-ndk-profiler 上下载,直接 download zip 压缩包或者使用 git
git clone git@github.com:richq/android-ndk-profiler.git下下来之后的目录结构
|-android-ndk-profiler
    |-docs
    |-example
    |-jni
    |-test
我们要用的就是 jni 目录下的文件,在特定的目录下新建一个文件夹 android-ndk-profiler,把 jni 目录下的所有文件拷到新建的文件夹下面。这里说的特定的目录是指 ndk 能搜索到的目录,我用的 cocos2d-x3.10,有两种创建项目的方式,源代码方式和预编译库方式,使用源代码方式创建的项目 ndk 能搜索到的目录如下:
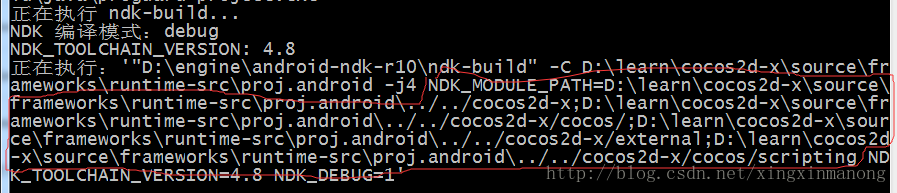
使用预编译库创建的项目 ndk 能搜索到的目录如下:
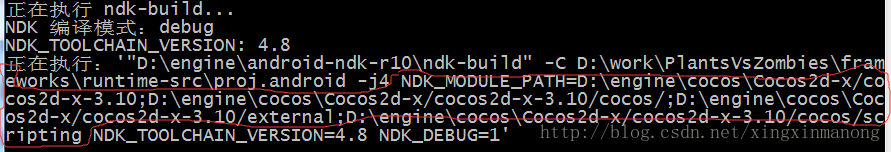
总结起来就是 \%COCOS_ROOT%; %COCOS_ROOT%/cocos; %COCOS_ROOT%/external; %COCOS_ROOT%/scripting 这四个路径。只不过源代码的方式会在项目的根目录下创建一个 cocos2d-x 目录,然后把引擎的源代码拷贝过来,因此 ndk 搜索的目录基于项目路径。而预编译库的方式不会拷贝任何源代码,因此 ndk 搜索的路径基于引擎安装的目录。
把 android-ndk-profiler/jni 下面的文件拷贝到这四个路径之一,比如拷贝到 %COCOS_ROOT%/external/android-ndk-profiler 目录下,然后修改 android.mk 文件,添加下面的代码
APP_DEBUG := $(strip $(NDK_DEBUG))
ifeq ($(APP_DEBUG),1)
  LOCAL_CFLAGS := -pg
  LOCAL_STATIC_LIBRARIES += android-ndk-profiler
endif
ifeq ($(APP_DEBUG),1)
  $(call import-module,android-ndk-profiler)
endif
然后以 debug 方式进行编译,编译成功说明 android-ndk-profiler 已经成功集成到项目了。编译方式有
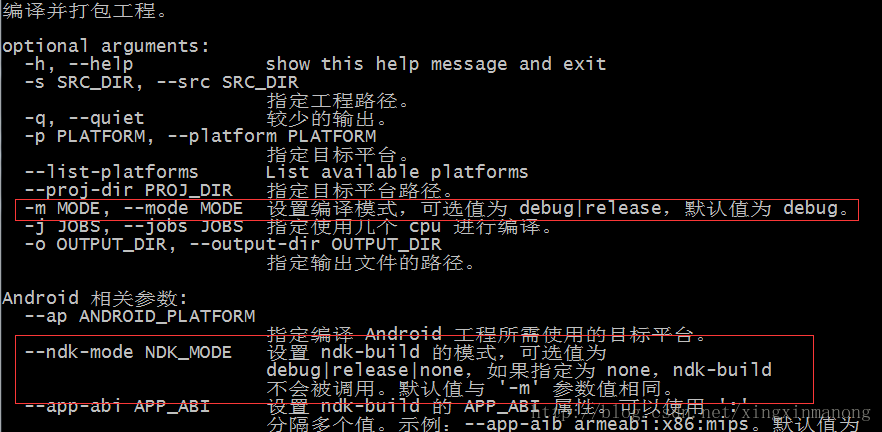
默认工程的编译方式和 ndk 的编译方式都是 debug,所以直接使用下面命令即可
cocos compile -p android如果不想把 android-ndk-profiler/jni 下面的文件拷贝到这四个路径之一,而是想放在其它地方,则要扩展 ndk 路径,在 android.mk 中添加
ANDROID_NDK_PROFILER_PATH := D:/work/project/frameworks
$(call import-add-path,$(ANDROID_NDK_PROFILER_PATH))
LOCAL_C_INCLUDES += $(ANDROID_NDK_PROFILER_PATH)
这样就可以把文件放在 D:/work/project/frameworks 目录下了。
接下来就是在代码中使用 android-ndk-profiler 了,打开 AppDelegate.cpp,添加下面代码
#if (COCOS2D_DEBUG>0 && CC_TARGET_PLATFORM == CC_PLATFORM_ANDROID)
#include "android-ndk-profiler/prof.h"
#endif

bool AppDelegate::applicationDidFinishLaunching()
{
    //...
#if (COCOS2D_DEBUG>0 && CC_TARGET_PLATFORM == CC_PLATFORM_ANDROID)
    monstartup("libcocos2dlua.so");
#endif
}

void AppDelegate::applicationDidEnterBackground()
{
    //...
#if (COCOS2D_DEBUG>0 && CC_TARGET_PLATFORM == CC_PLATFORM_ANDROID)
    moncleanup();
#endif
}
monstartup 的参数根据具体的项目类型而定,我创建的是 lua 项目,所以是 libcocos2dlua.so,可以到 proj.android/lib/\armeabi 下查看。
然后重新进行编译,可能会出现下面的错误
jni/../../Classes/AppDelegate.cpp:82: error: undefined reference to 'monstartup'这是因为在链接 android-ndk-profiler 库时失败,打开 android.mk,添加
LOCAL_STATIC_LIBRARIES := cocos2d_lua_static
LOCAL_STATIC_LIBRARIES += cocos2d_simulator_static
# 新添加
LOCAL_STATIC_LIBRARIES += android-ndk-profiler
再重新编译,可能会出现下面的错误
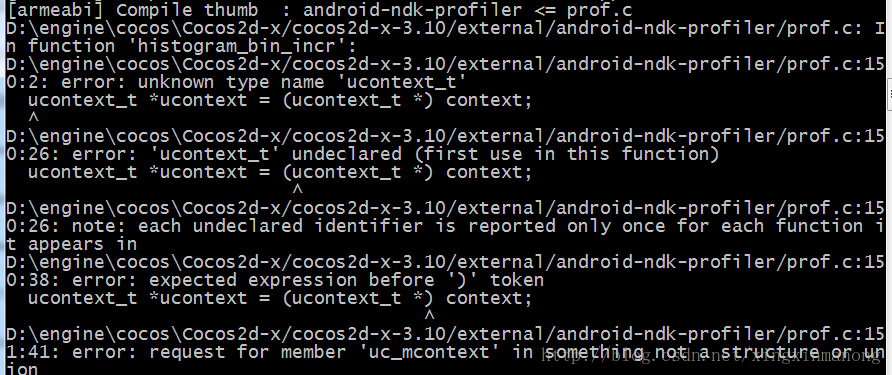
这是因为使用的 ndk 版本没有 ucontext_t 这个类型,换了 ndk 版本就可以了,像我开始用的是 ndk-r10c,改用 ndk-r10e 就可以了。
还有一点要注意的,为了能正常生成报告,我们的游戏必须有写入文件的权限,打开 AndroidMainfest.xml 文件,看看有没有下面这一句,如果没有的话则加上
<uses-permission android:name="android.permission.WRITE_EXTERNAL_STORAGE" />解读性能分析报告
把 android-ndk-profiler 集成在游戏之后,在 android 手机上跑一遍游戏,会生成一个 gmon.out 文件,这个文件就是我们需要的性能分析报告。默认生成的 gmon.out 的路径为 /sdcard/gmon.out,即放在内部存储的根目录。如果想自定义存放位置,则在调用 moncleanup 之前指定存放位置
setenv("CPUPROFILE", "/data/data/com.example.application/files/gmon.out", 1);
moncleanup();
把 gmon.out 拷贝到电脑上,这是一个二进制文件,无法直接查看内容,得先转换成文本文件。ndk 提供了专门的转换工具
cd android-ndk-r10e/toolchains/arm-linux-androideabi-4.9/prebuilt/darwin-x86_64/bin/

./arm-linux-androideabi-gprof \
  项目路径/proj.android/obj/local/armeabi/libcocos2dlua.so \
  存放路径/gmon.out > gmon.txt
下面看看 gmon.txt 的内容
Flat profile:

Each sample counts as inf seconds.
  %   cumulative   self              self     total
 time   seconds   seconds    calls  Ts/call  Ts/call  name
  6.52       inf      inf                             __addsf3
  5.98       inf      inf                             cocos2d::MathUtilC::transformVec4(float const*, float, float, float, float, float*)
  4.89       inf      inf                             inflate_fast
  3.26       inf      inf                             __mulsf3
  2.17       inf      inf                             cocos2d::Node::processParentFlags(cocos2d::Mat4 const&, unsigned int)
  1.63       inf      inf                             cocos2d::ComponentContainer::visit(float)
  1.63       inf      inf                             cocos2d::Node::visit(cocos2d::Renderer*, cocos2d::Mat4 const&, unsigned int)
  1.36       inf      inf                             cocos2d::Renderer::fillQuads(cocos2d::QuadCommand const*)
  1.36       inf      inf                             void cocos2d::Scheduler::scheduleUpdate<cocos2d::Node>(cocos2d::Node*, int, bool)::{lambda(float)#1}::operator()(float) const
  1.36       inf      inf                             adler32
  1.09       inf      inf                             std::_Deque_iterator<cocos2d::Mat4, cocos2d::Mat4&, cocos2d::Mat4*>::operator--()
  0.82       inf      inf                             cocos2d::ui::Button::adaptRenderers()
  0.82       inf      inf                             cocos2d::Director::drawScene()
  0.82       inf      inf                             cocos2d::Renderer::drawBatchedTriangles()
  0.82       inf      inf                             cocos2d::Node::isVisitableByVisitingCamera() const


             Call graph (explanation follows)


granularity: each sample hit covers 2 byte(s) for 0.17% of 5.99 seconds

index % time    self  children    called     name
                                                 <spontaneous>
[1]     19.4    1.16    0.00                 png_read_filter_row_paeth_multibyte_pixel [1]
-----------------------------------------------
                                                 <spontaneous>
[2]     15.5    0.93    0.00                 cocos2d::Image::premultipliedAlpha() [2]
-----------------------------------------------
                                                 <spontaneous>
[3]     14.5    0.87    0.00                 cocos2d::Texture2D::convertRGBA8888ToRGBA4444(unsigned char const*, int, unsigned char*) [3]
-----------------------------------------------
                                                 <spontaneous>
[4]      7.2    0.43    0.00                 profCount [4]
-----------------------------------------------
                                                 <spontaneous>
[5]      4.0    0.24    0.00                 png_read_filter_row_up [5]
-----------------------------------------------
解释一下含义
Flat profile:

Each sample counts as 0.01 seconds.
  %   cumulative   self              self     total
 time   seconds   seconds    calls  ms/call  ms/call  name
 函数     程序       函数       函数    函数     函数      函数名
 消耗     累计       本身       调用    平均     平均
 时间     执行       执行       次数    执行     执行
 占程     时间       时间              时间     时间
 序运                                 (不      (包
 行时                                  包       括
 间的                                  括       被
 百分                                  被       调
 比                                    调       用
                                      用       时
                                      时       间)
                                      间)


           Call graph (explanation follows)


granularity: each sample hit covers 2 byte(s) for 0.17% of 5.99 seconds

index % time    self  children    called     name
 索引    函数     函数   函数的       被调用      函数名
 值      执行     本身   子函数        次数
        时间     执行    执行
        占程     时间    时间
        序运
        行时
        间百
        分比