转自:Matlab的Profile功能 - CSDN博客 https://blog.csdn.net/shaoxiaohu1/article/details/46481123
编程过程中,经常需要评估哪一部分代码比较耗费时间,这对于优化代码非常重要。Visual Studio中的profile功能可以评测,Matlab同样也有这个功能,而且使用起来也比较简单。
-基本命令
profile on : 开启profile
profile off: 关闭profile
profile clear: 清空历史数据
profile viewer: 查看profile 结果
-示例1
引自Matlab 中帮助文档:
profile on  % 开启 profile
plot(magic(35)) % 绘制magic矩阵
profile viewer  % 查看profile结果
p = profile('info');
profsave(p,'profile_results') % 保存profile 结果- 1
- 2
- 3
- 4
- 5
profile结果为:
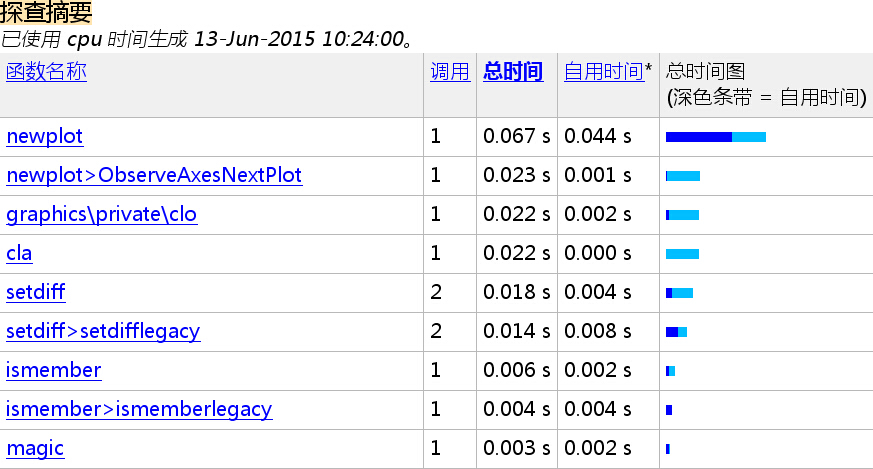
这个结果一目了然,各函数所占用时间、调用次数、整体分布情况一目了然,这里不再多做解释。
-示例2
在使用过程中,我更喜欢在workspace中输入profile view命令,调出profile查看窗口,然后直接运行要测试的程序:
在“运行此代码”的文本框中输入要运行的程序名字,即可得到结果。
我要运行的代码名称为:TestAviReader.m,是一段读取和显示数据视频的简单文件。

xyloObj = VideoReader('test.avi');

nFrames = xyloObj.NumberOfFrames;
vidHeight = xyloObj.Height;
vidWidth = xyloObj.Width;

fh = figure('Name', 'Dataset Checking');
ah = axes('parent', fh);
for k = 1 : nFrames
    img = read(xyloObj,k);
    disp('当前播帧数:'),disp(k);
    imshow(img, 'Parent', ah);
    pause(0.001)
end- 1
- 2
- 3
- 4
- 5
- 6
- 7
- 8
- 9
- 10
- 11
- 12
- 13
- 14
最终的profile结果为:
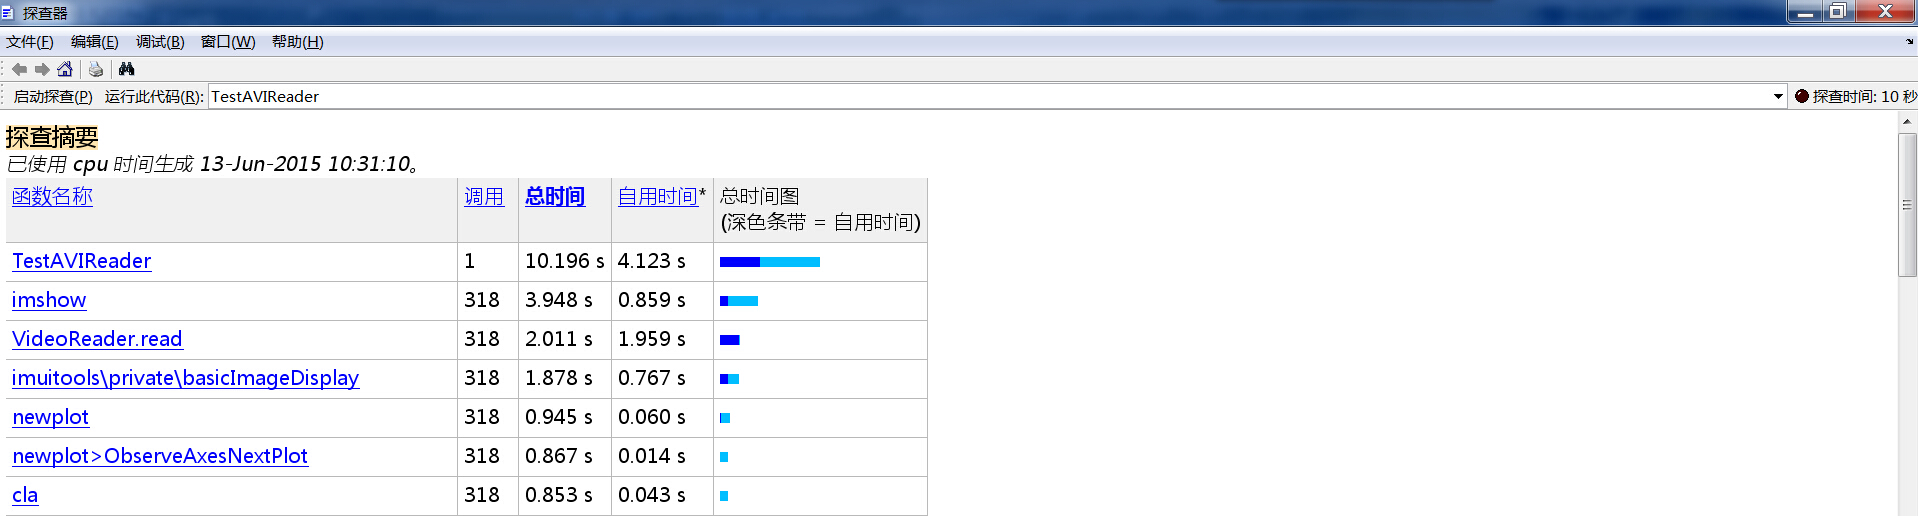
从结果来看,运行基本时间主要在imshow上。
-参考-
扫描二维码关注公众号,回复:
1758947 查看本文章

http://developer.51cto.com/art/201104/255128_all.htm