安装prometheus
系统
[root@i-u7jq7uyl ~]# cat /etc/redhat-release
CentOS Linux release 7.2.1511 (Core)本文档只是部署单节点,要部署多个节点请参考官方federation
下载prometheus,也可以自己编译download
wget https://github.com/prometheus/prometheus/releases/download/v2.2.1/prometheus-2.2.1.linux-amd64.tar.gz解压prometheus
tar -zxvf prometheus-2.2.1.linux-amd64.tar.gz启动prometheus
[root@i-vzdytl5t prometheus-2.2.1.linux-amd64]# ./prometheus
level=info ts=2018-05-26T08:28:25.473673104Z caller=main.go:220 msg="Starting Prometheus" version="(version=2.2.1, branch=HEAD, revision=bc6058c81272a8d938c05e75607371284236aadc)"
level=info ts=2018-05-26T08:28:25.473938997Z caller=main.go:221 build_context="(go=go1.10, user=root@149e5b3f0829, date=20180314-14:15:45)"
level=info ts=2018-05-26T08:28:25.474049794Z caller=main.go:222 host_details="(Linux 3.10.0-862.3.2.el7.x86_64 #1 SMP Mon May 21 23:36:36 UTC 2018 x86_64 i-vzdytl5t (none))"
level=info ts=2018-05-26T08:28:25.474148189Z caller=main.go:223 fd_limits="(soft=1024, hard=4096)"
level=info ts=2018-05-26T08:28:25.477875503Z caller=web.go:382 component=web msg="Start listening for connections" address=0.0.0.0:9090
level=info ts=2018-05-26T08:28:25.47785542Z caller=main.go:504 msg="Starting TSDB ..."
level=info ts=2018-05-26T08:28:25.483219348Z caller=main.go:514 msg="TSDB started"
level=info ts=2018-05-26T08:28:25.483277216Z caller=main.go:588 msg="Loading configuration file" filename=prometheus.yml
level=info ts=2018-05-26T08:28:25.484611923Z caller=main.go:491 msg="Server is ready to receive web requests."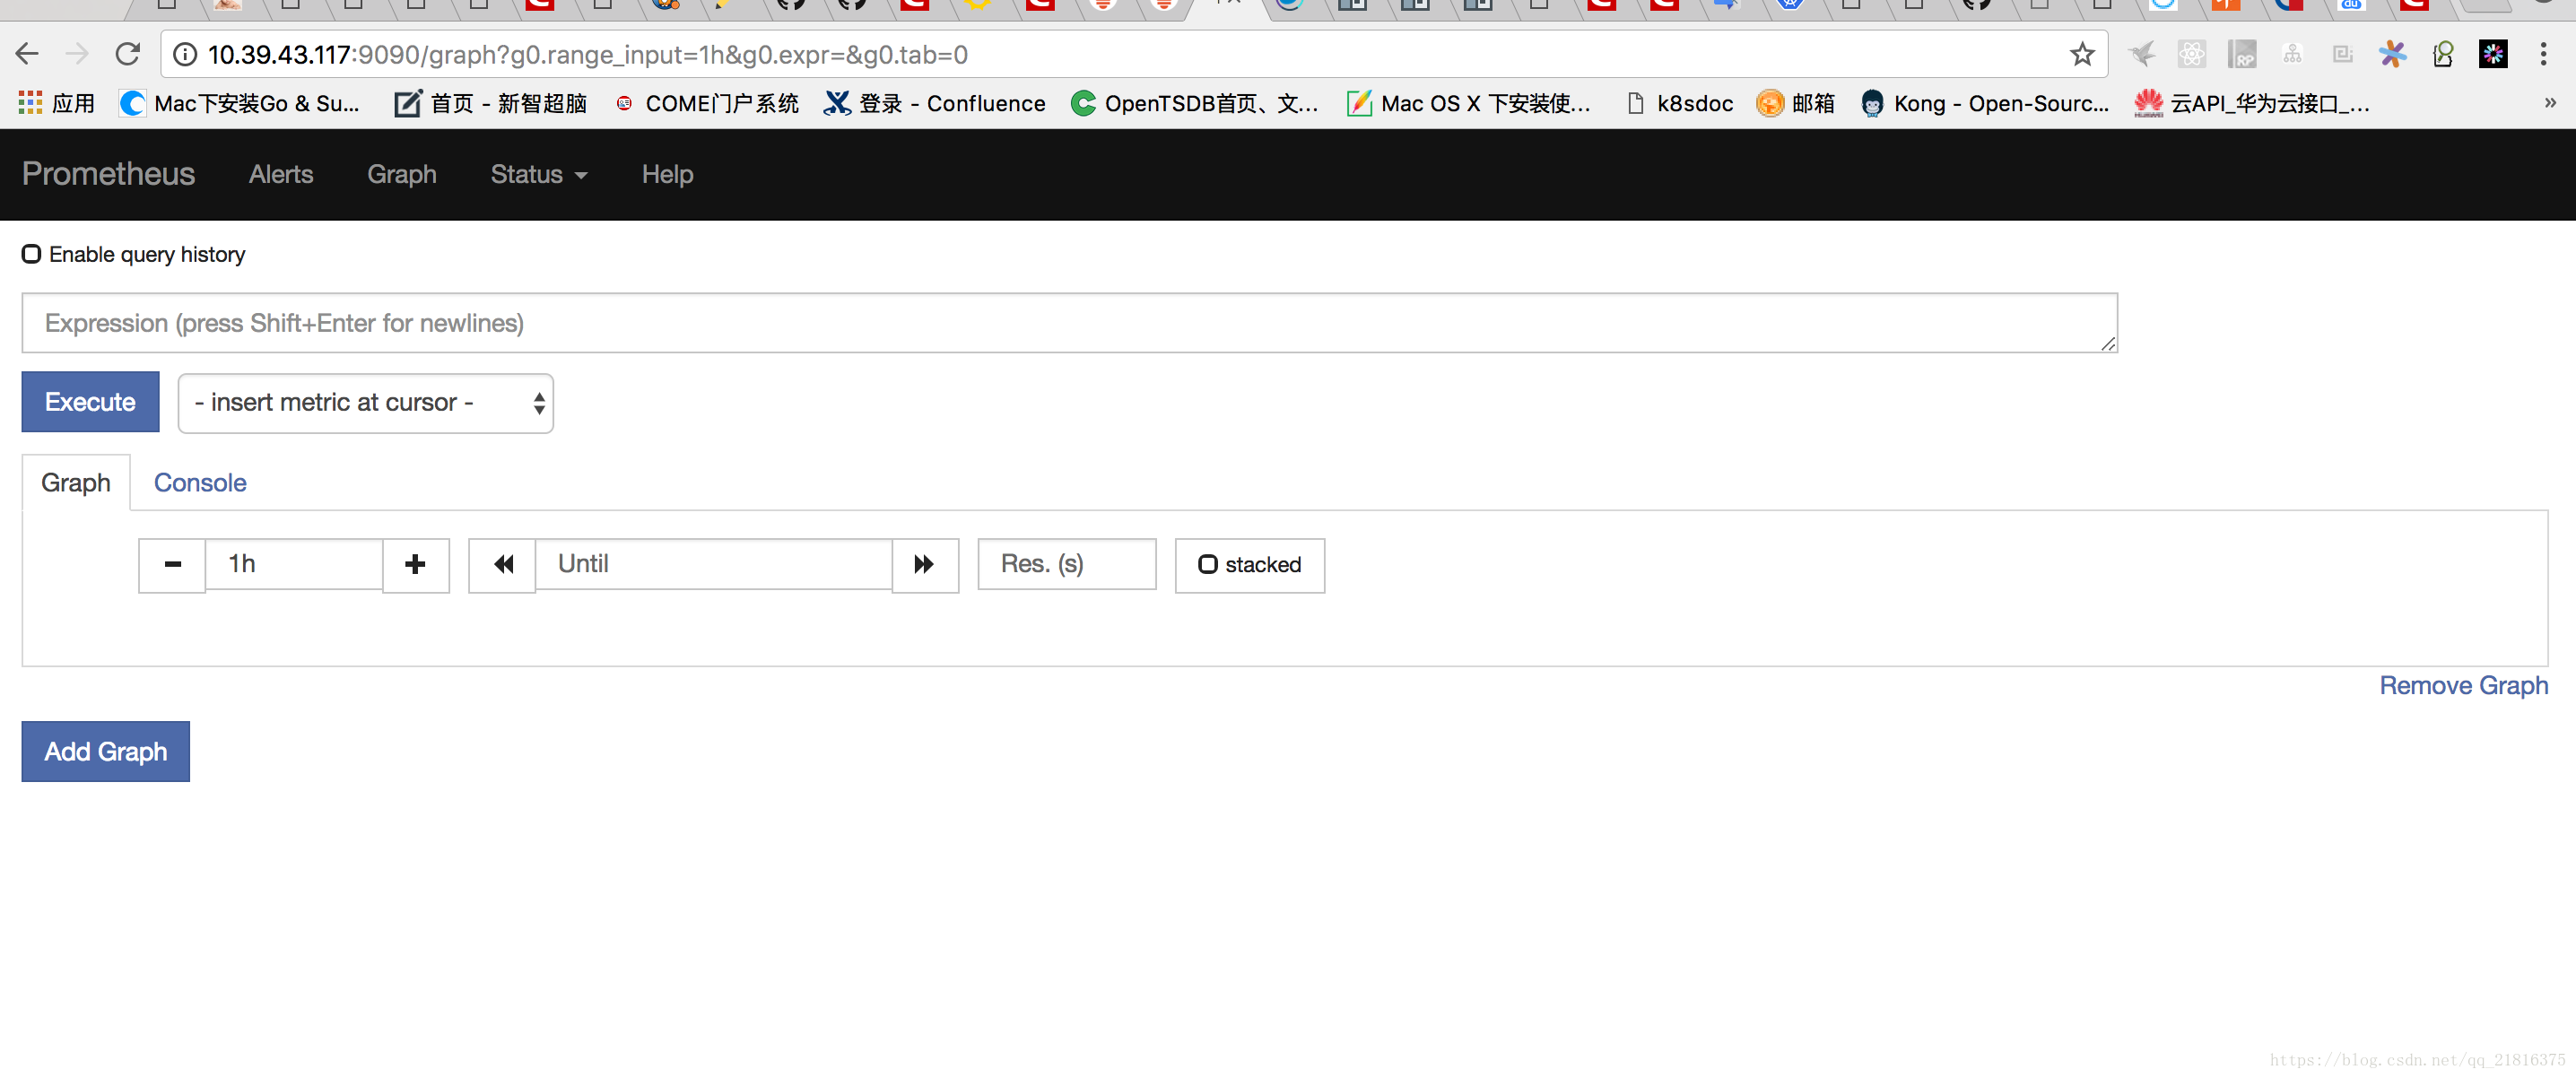
安装prometheus的dashboard grafana,安装文档grafana-installation 红帽安装
wget https://s3-us-west-2.amazonaws.com/grafana-releases/release/grafana-5.1.3-1.x86_64.rpm
yum install initscripts fontconfig  urw-fonts -y

[root@i-vzdytl5t prometheus]# rpm -Uvh grafana-5.1.3-1.x86_64.rpm
warning: grafana-5.1.3-1.x86_64.rpm: Header V4 RSA/SHA1 Signature, key ID 24098cb6: NOKEY
Preparing...                          ################################# [100%]
Updating / installing...
   1:grafana-5.1.3-1                  ################################# [100%]
### NOT starting on installation, please execute the following statements to configure grafana to start automatically using systemd
 sudo /bin/systemctl daemon-reload
 sudo /bin/systemctl enable grafana-server.service
### You can start grafana-server by executing
 sudo /bin/systemctl start grafana-server.service
POSTTRANS: Running script

root@i-vzdytl5t prometheus]# systemctl enable grafana-server.service
Created symlink from /etc/systemd/system/multi-user.target.wants/grafana-server.service to /usr/lib/systemd/system/grafana-server.service.
[root@i-vzdytl5t prometheus]# systemctl start grafana-server.service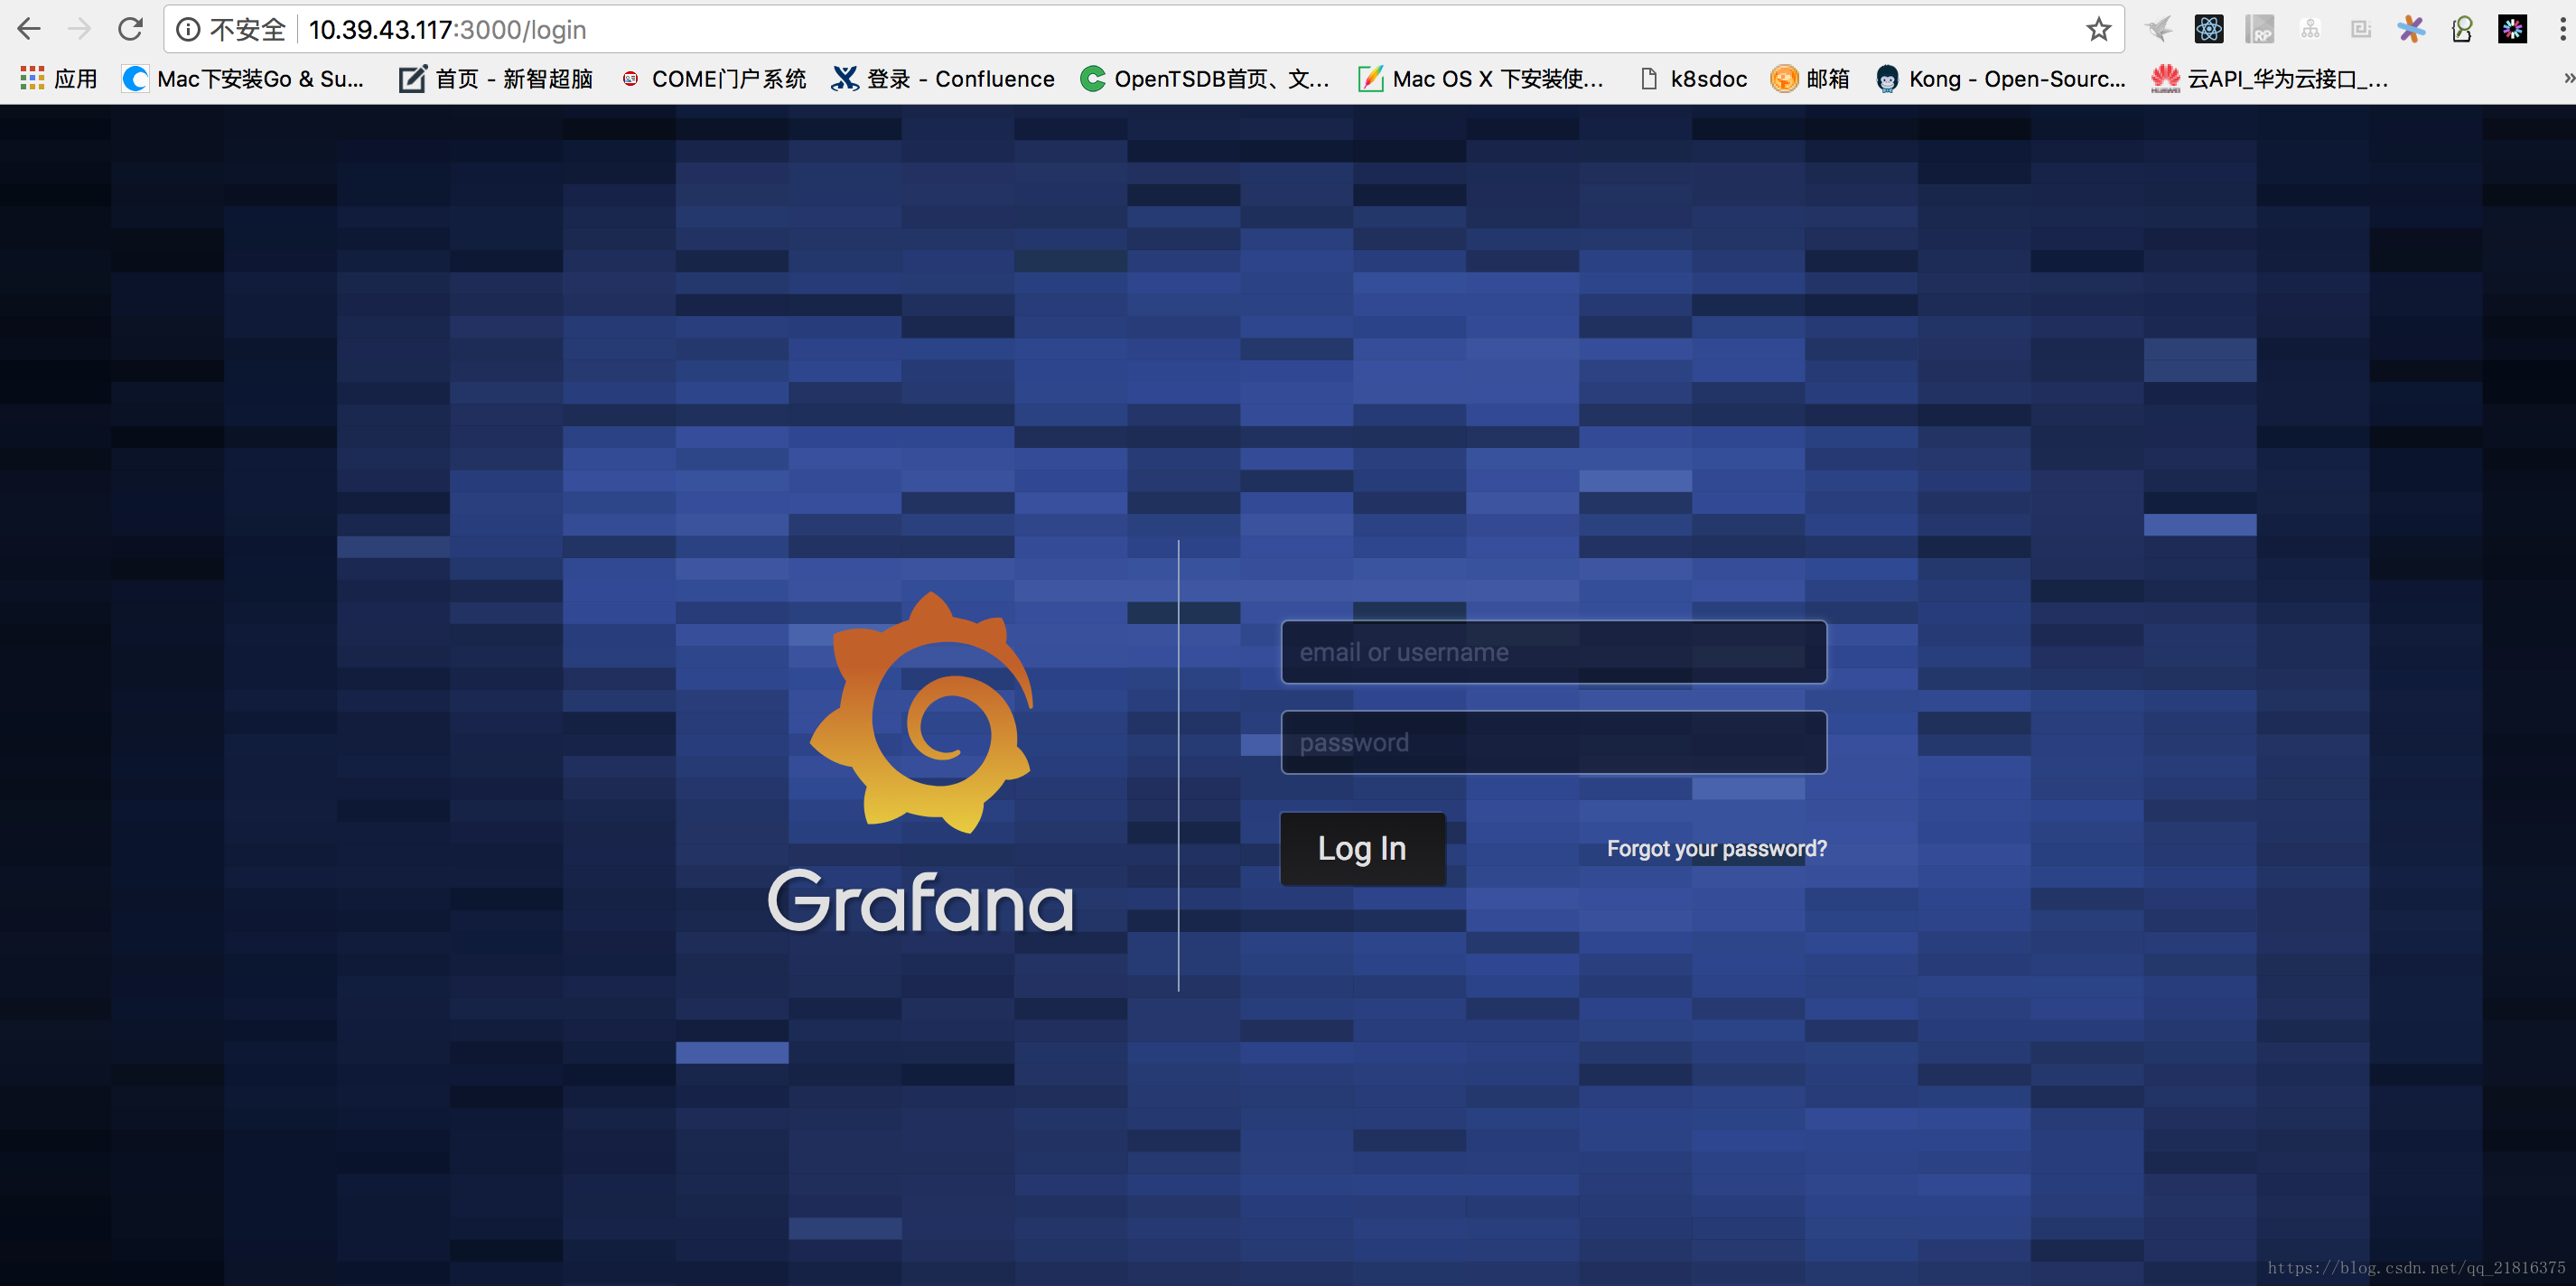
[root@i-vzdytl5t prometheus]# systemctl status grafana-server.service访问nodeIP:3000,用户/密码默认是admin/admin
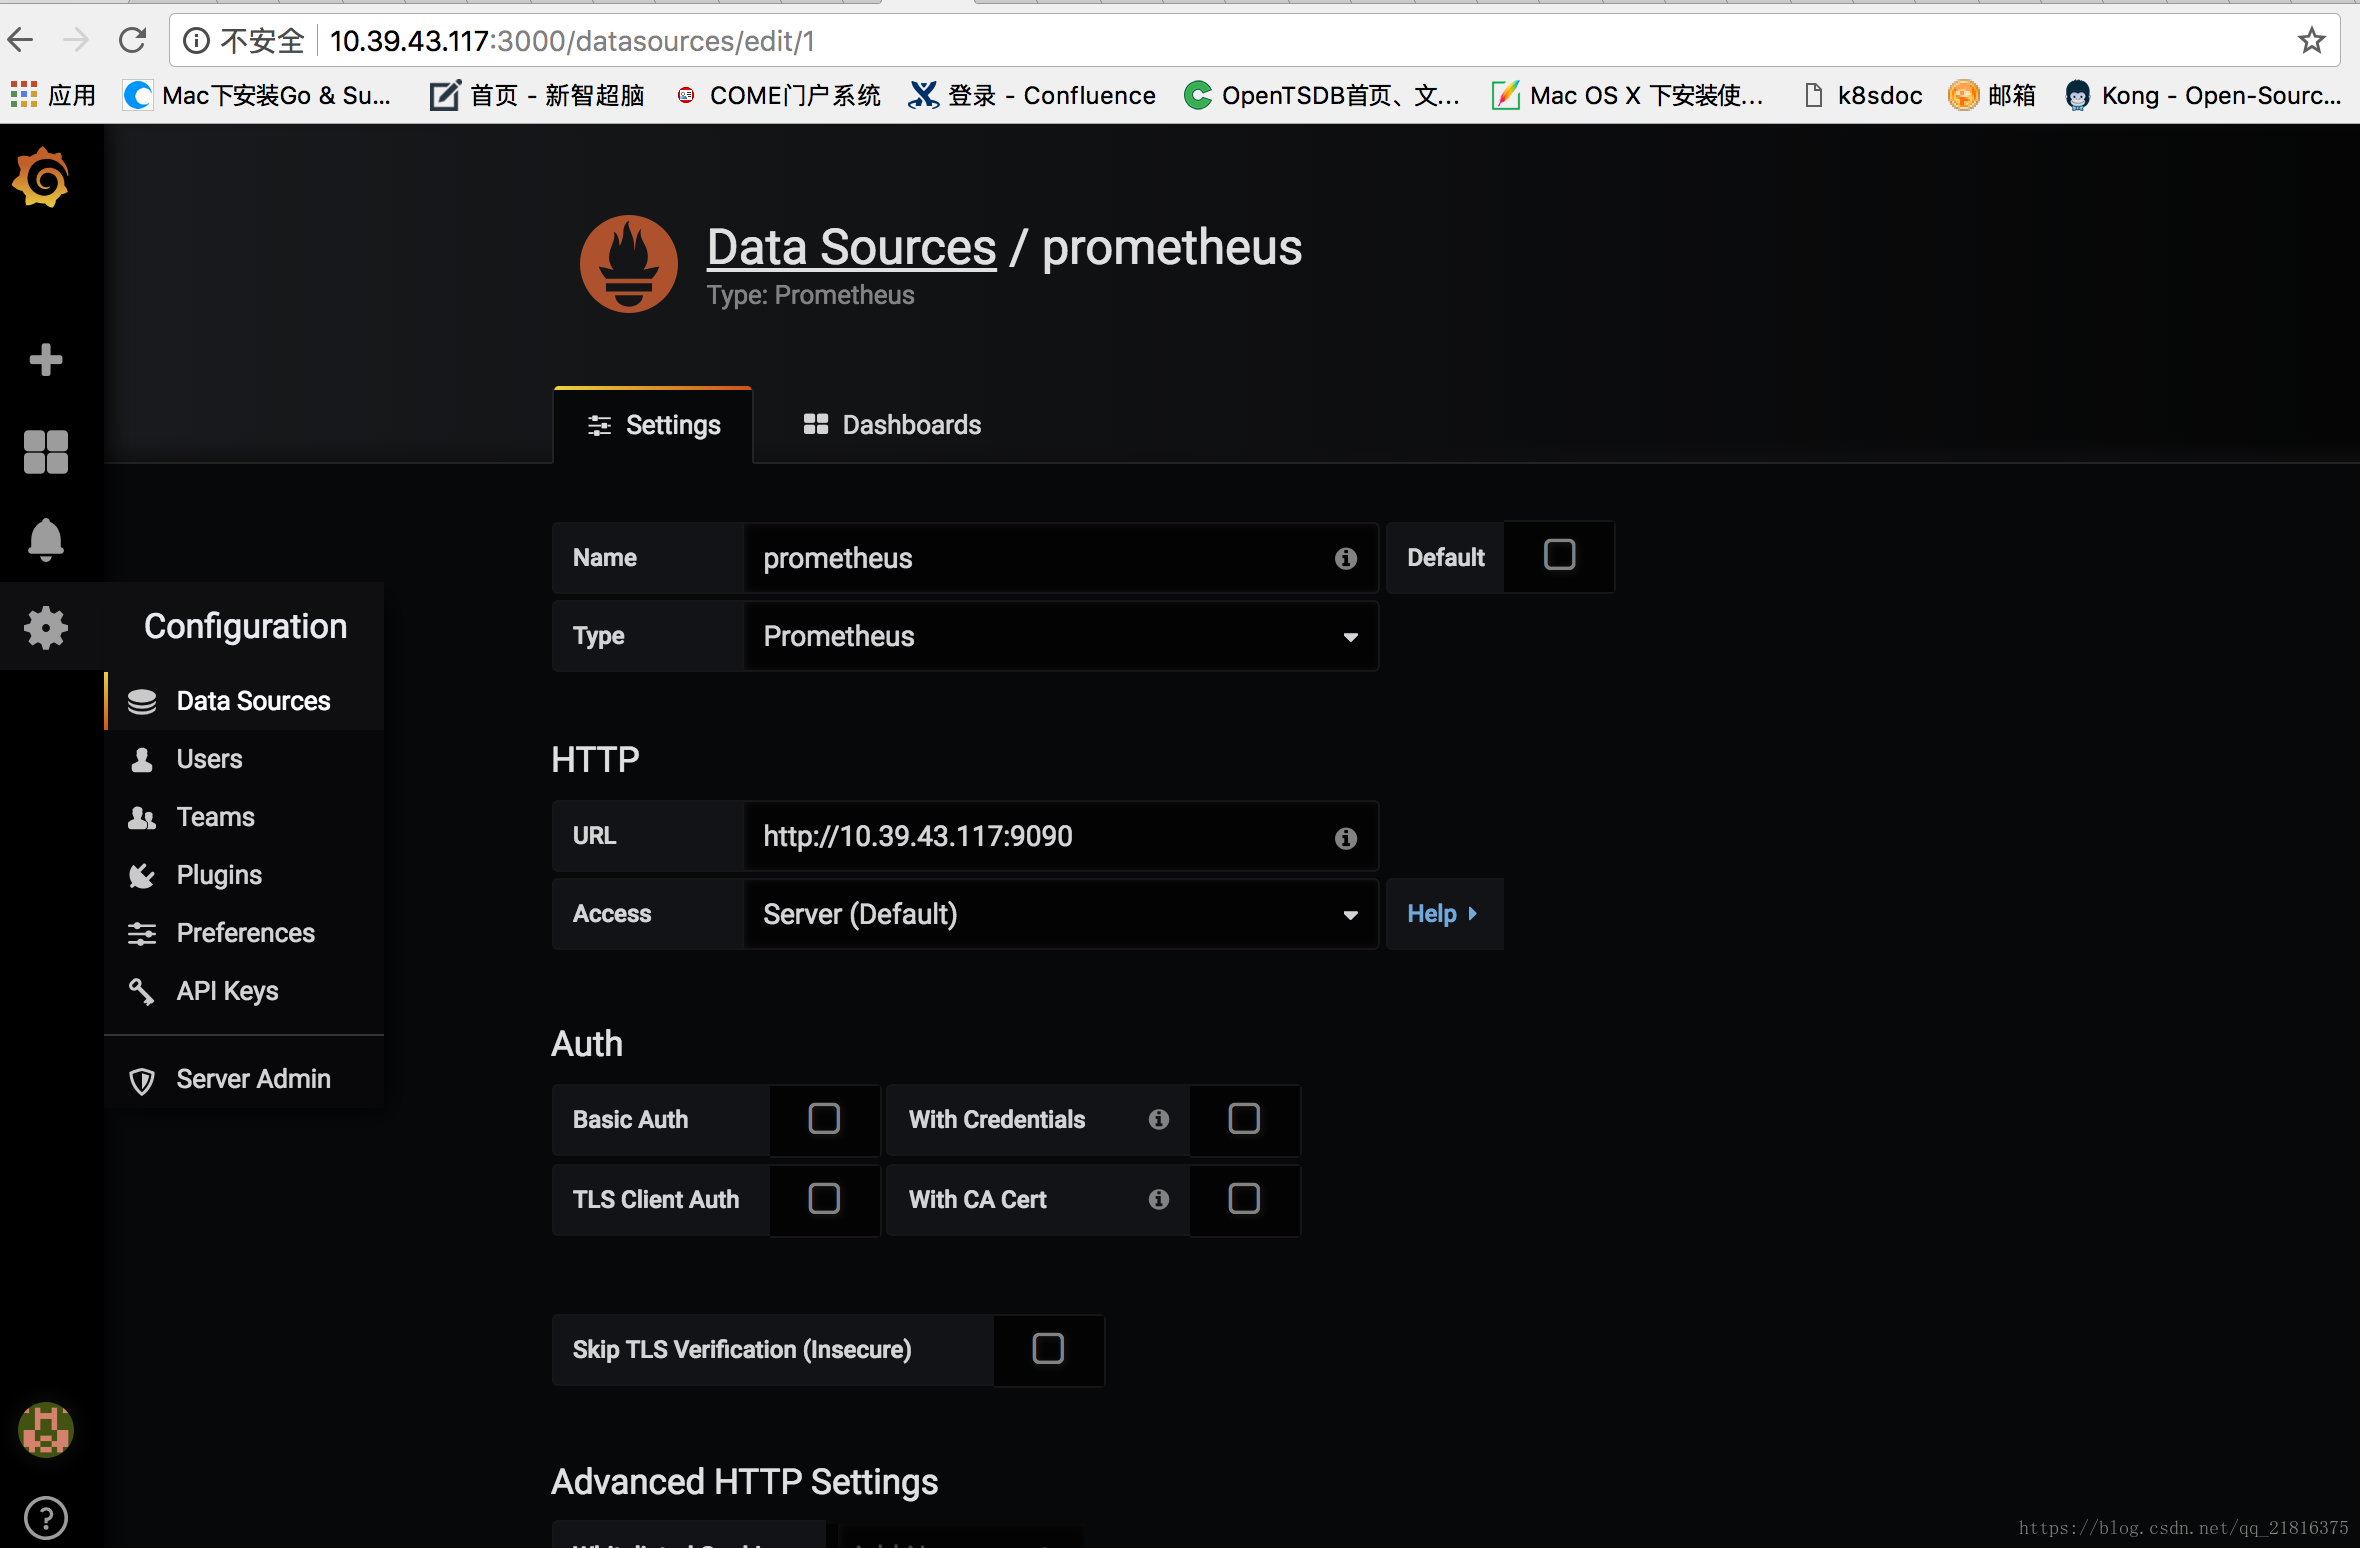
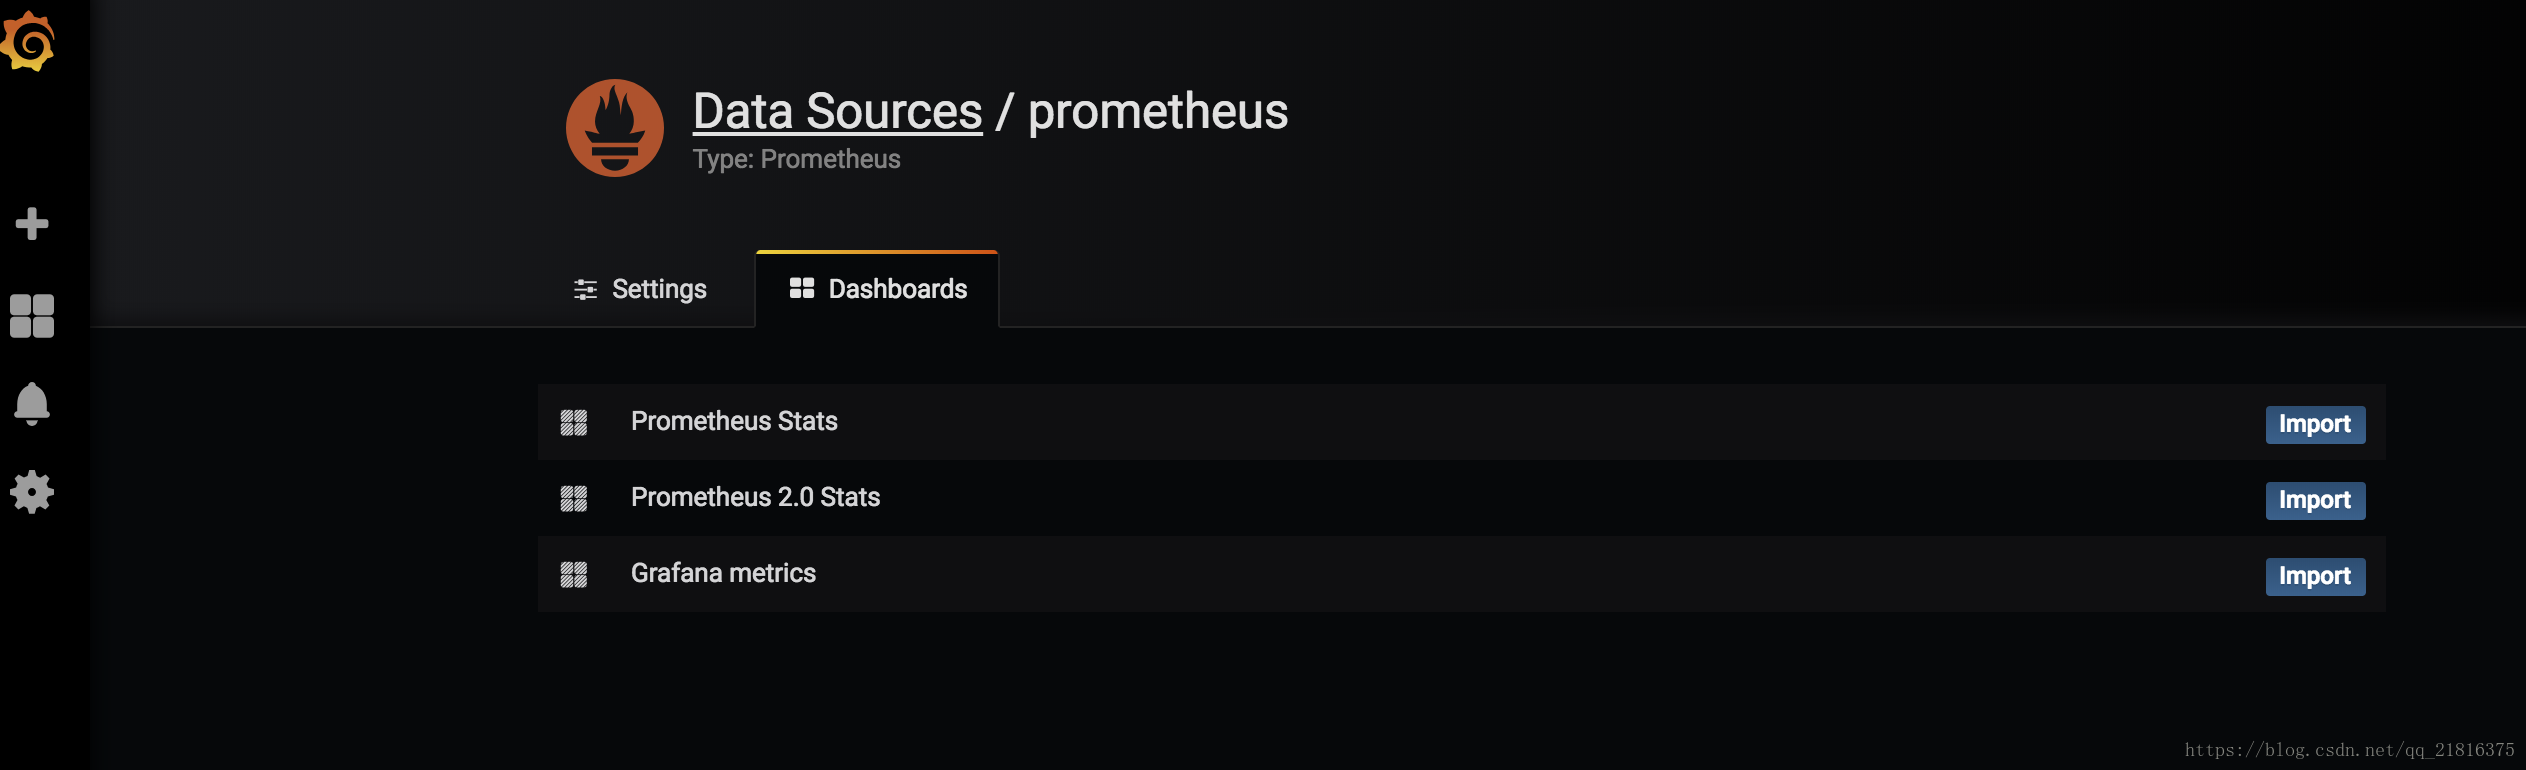
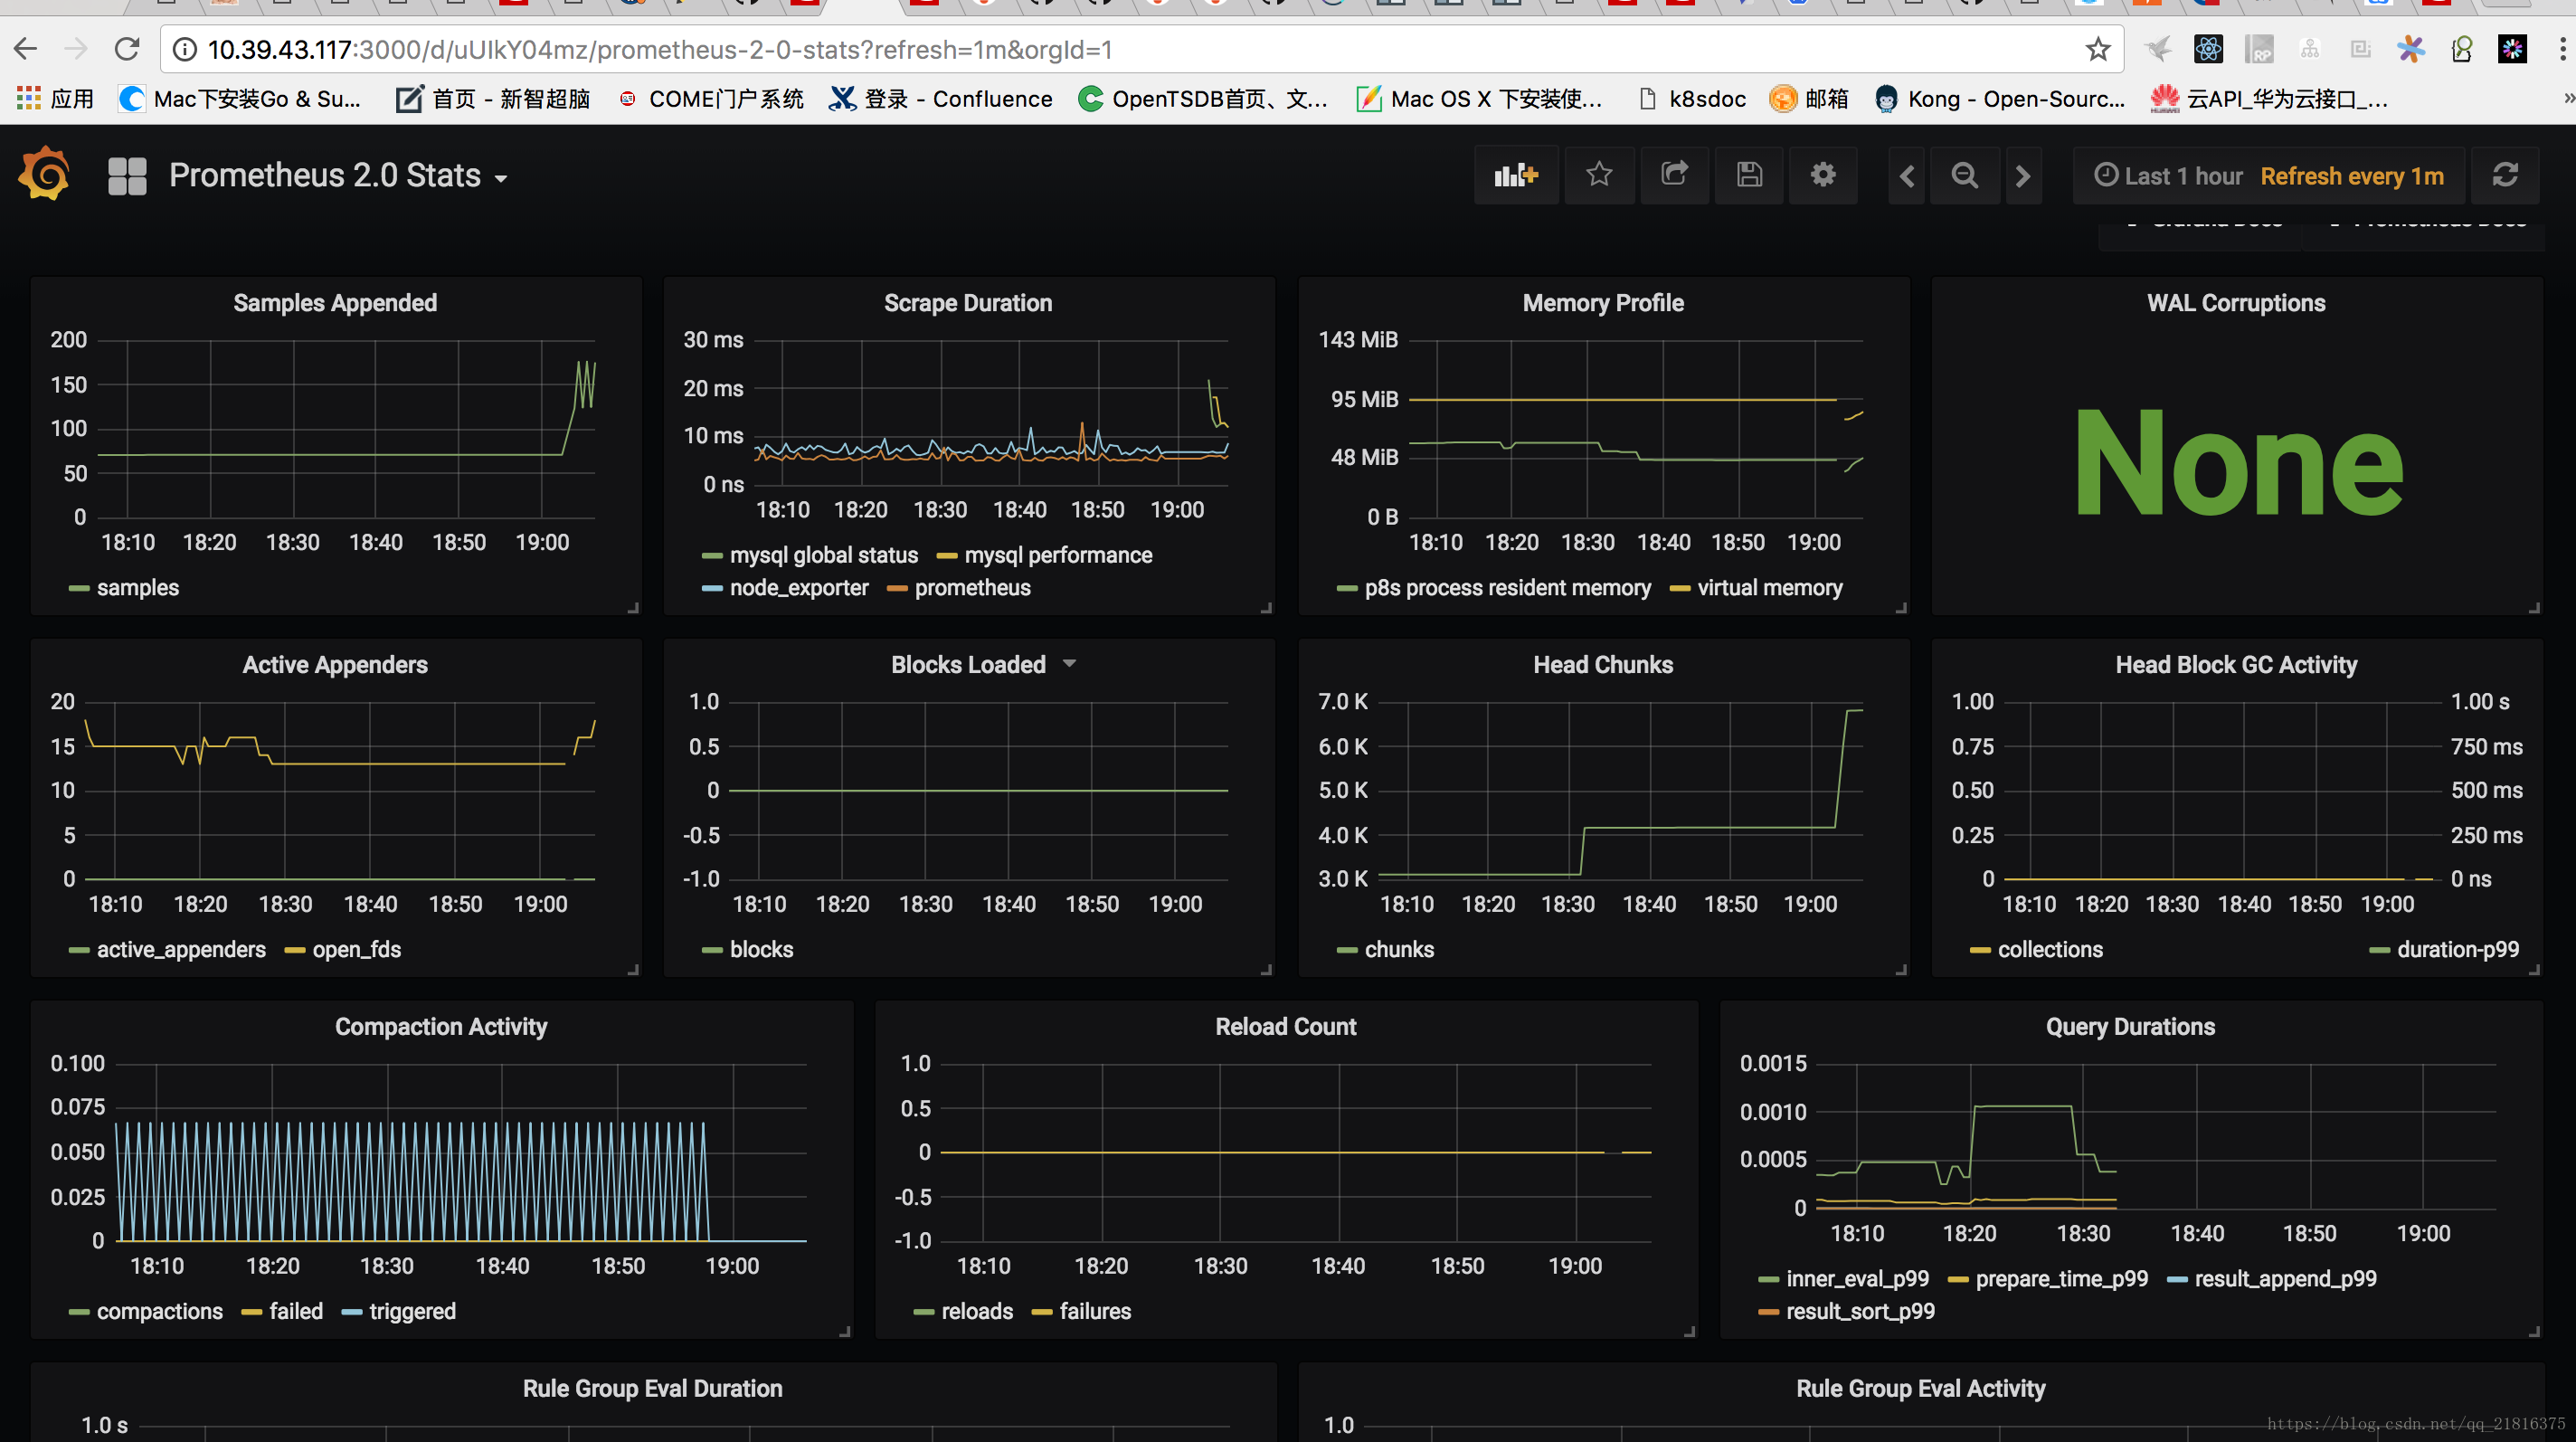
添加prometheus数据源,参考[pro-grafana]
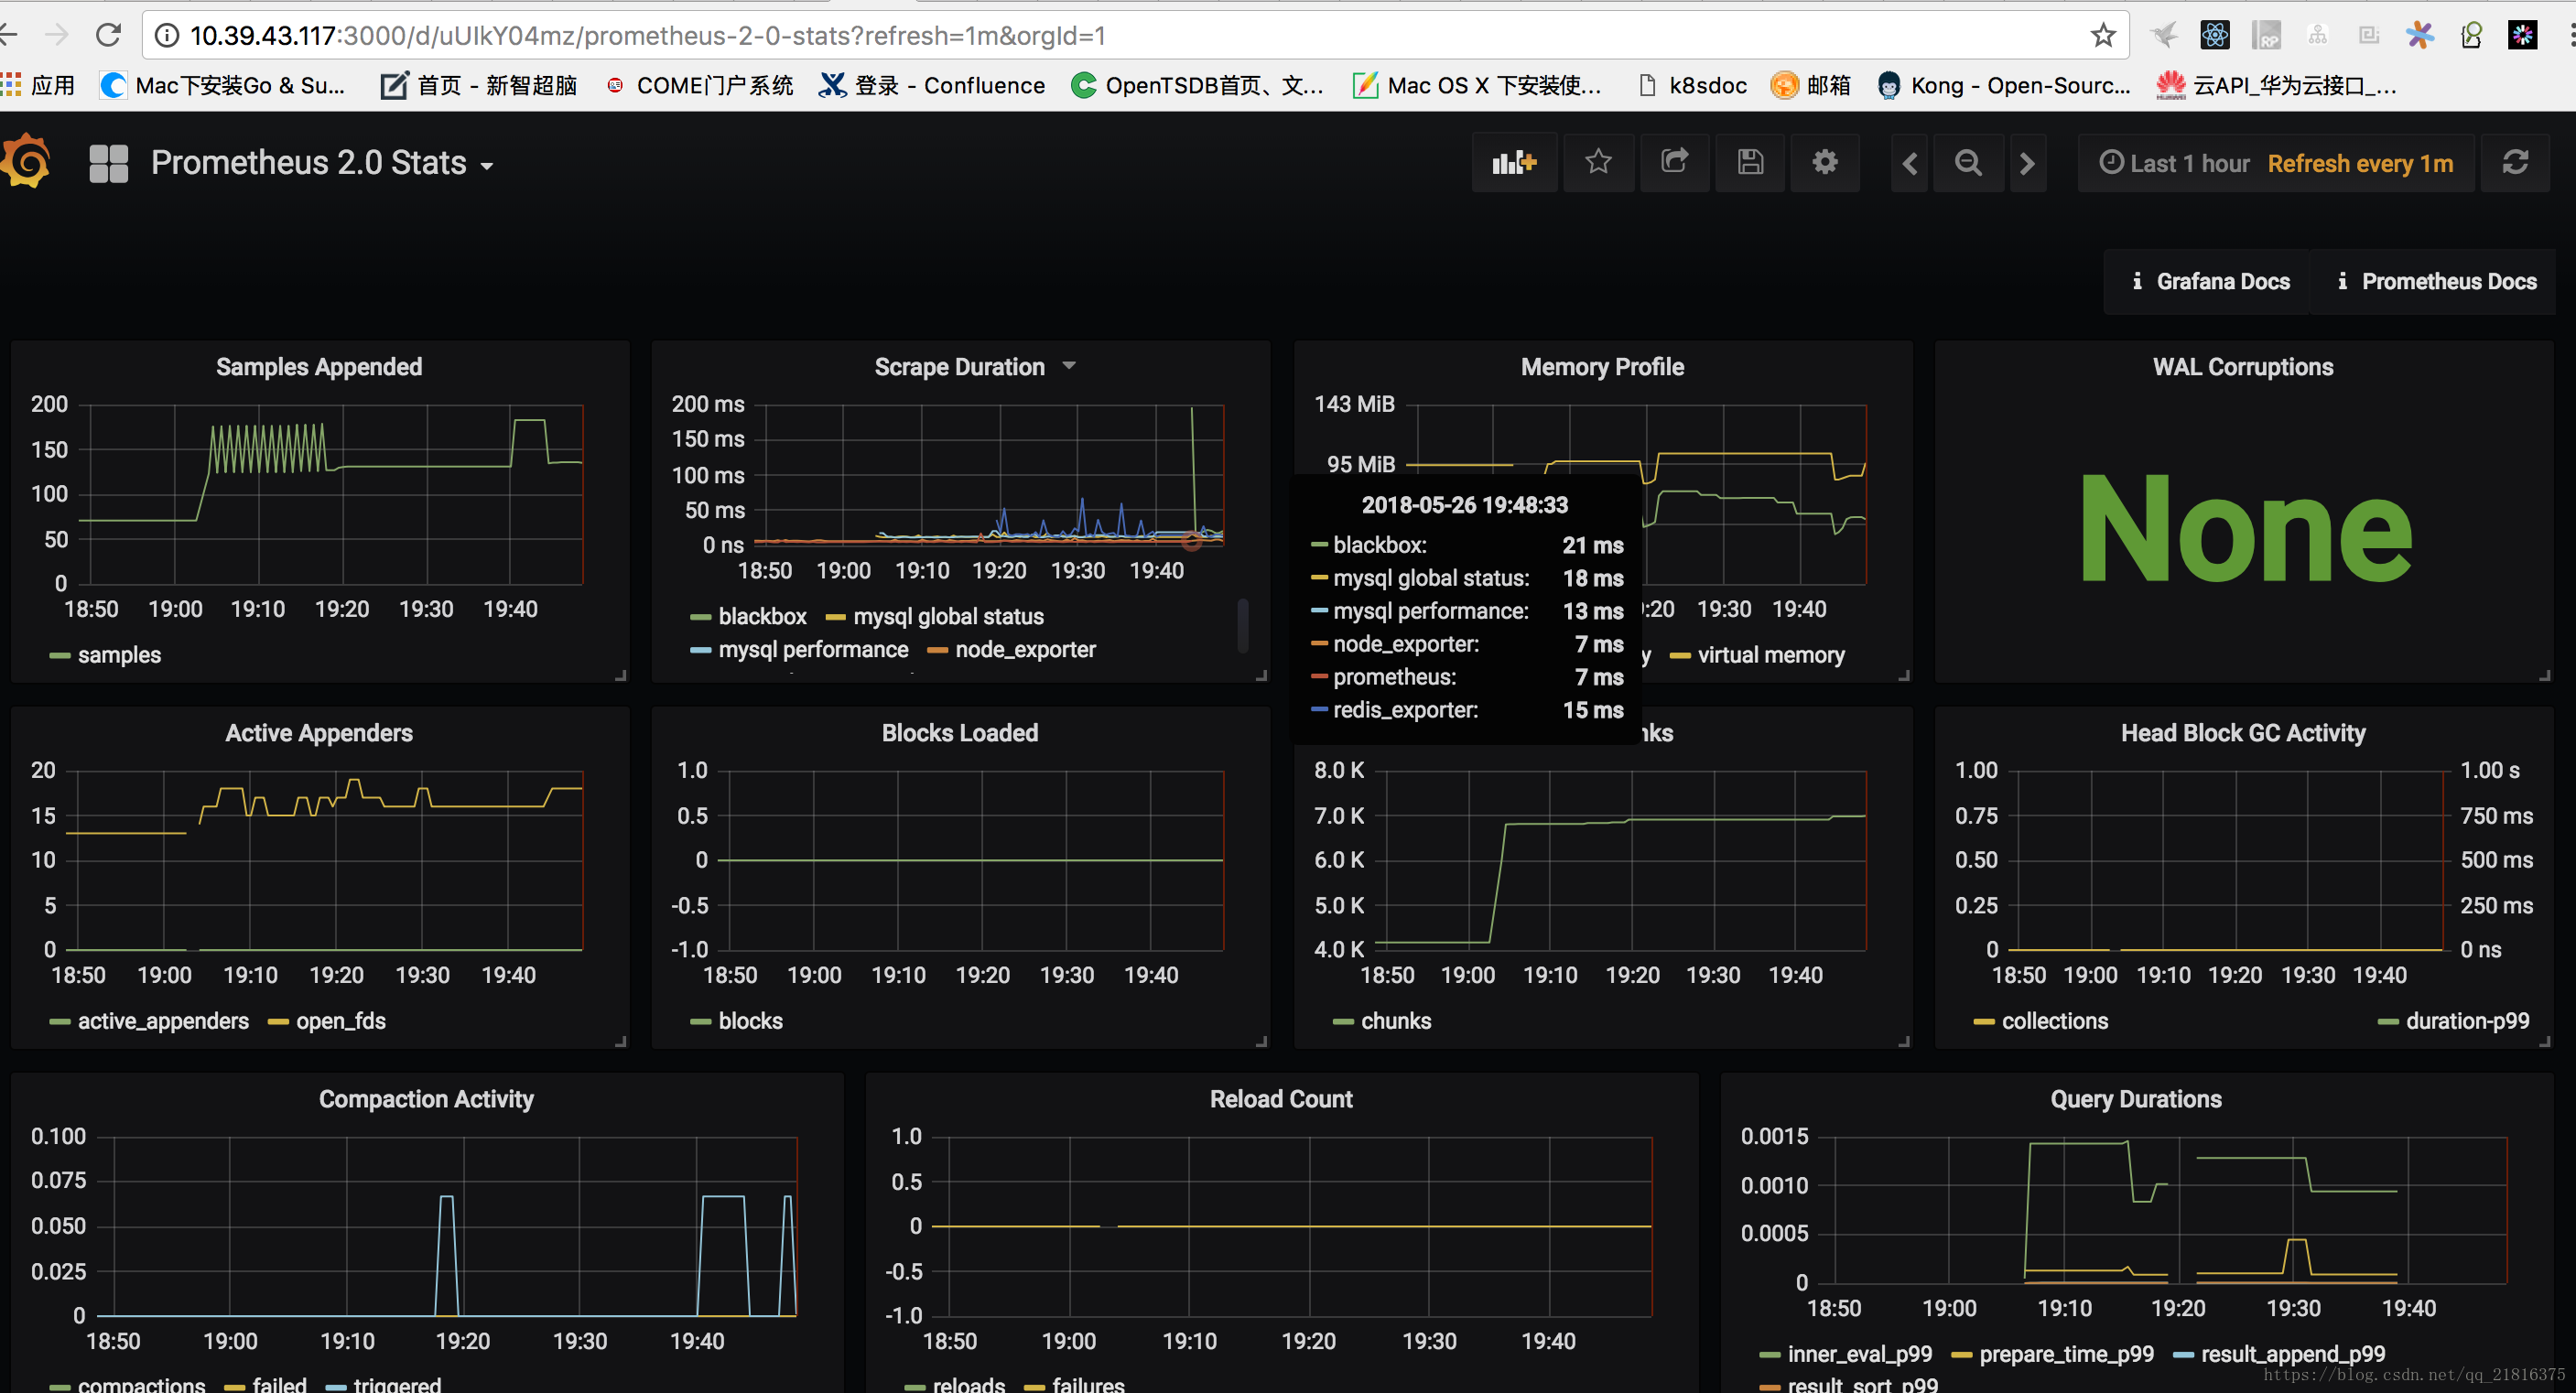
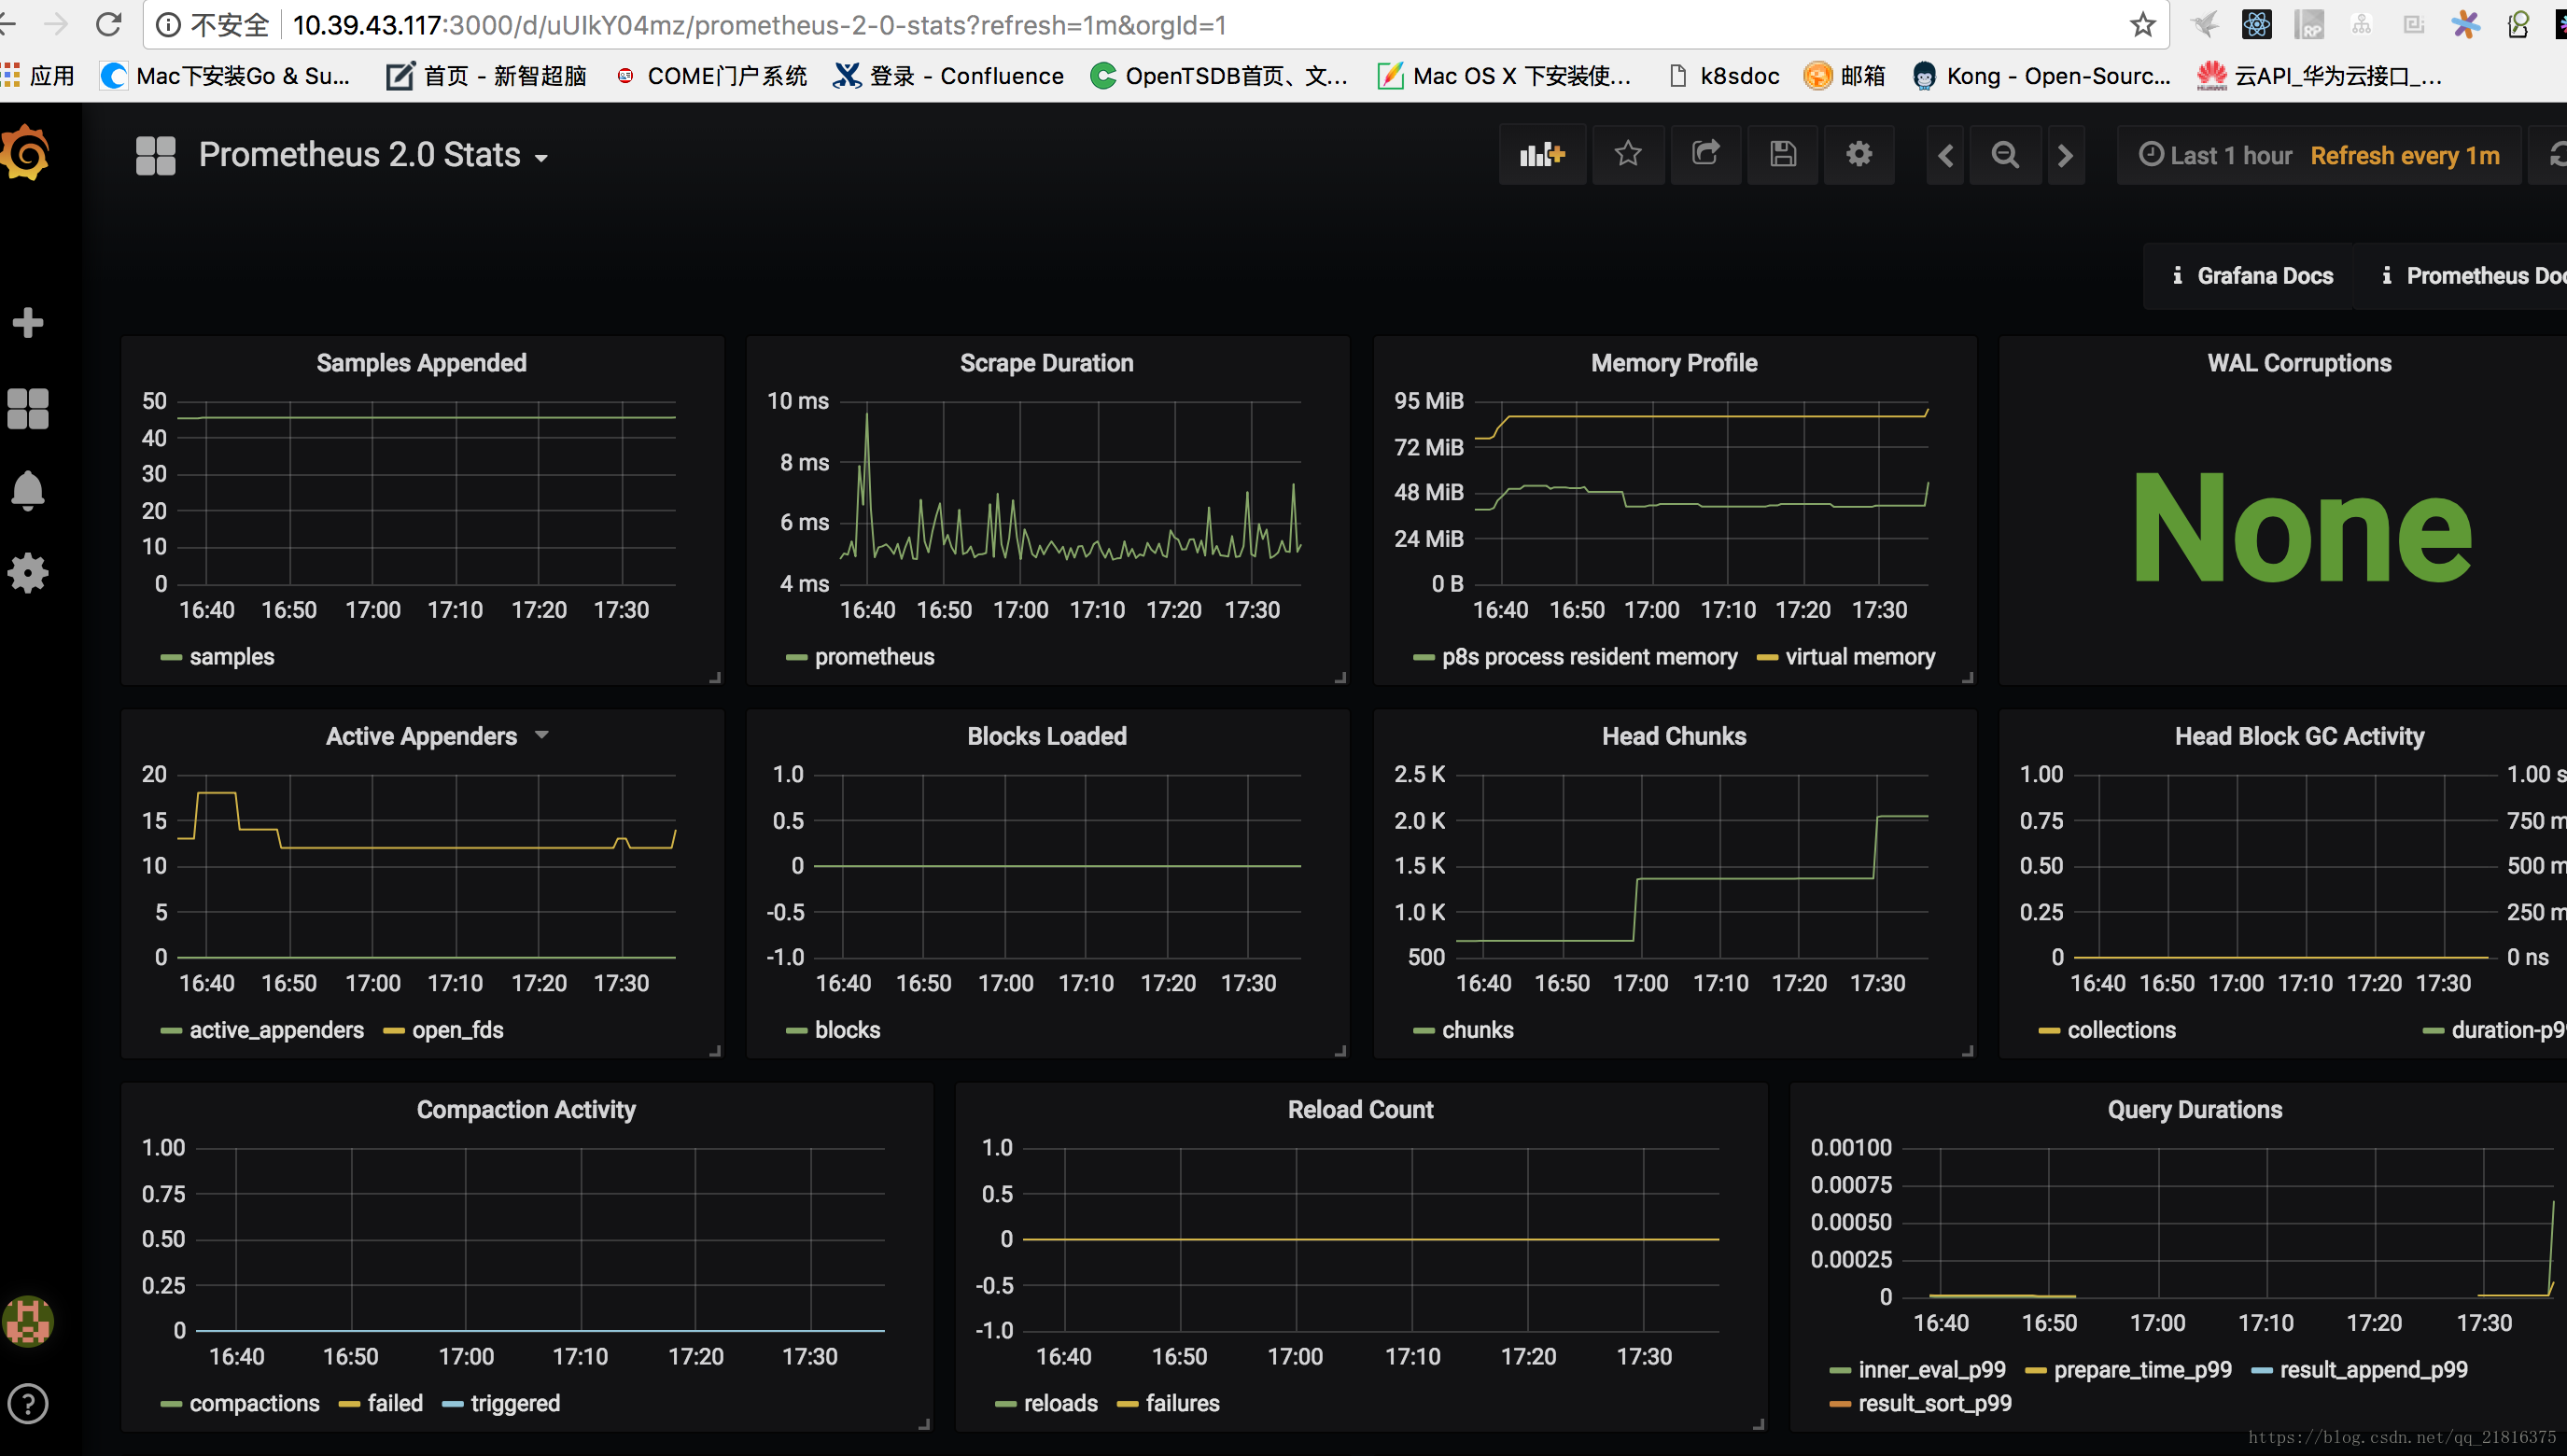
添加prometheus grafana的dashboard
部署监控主机
部署监控主机,需要安装node_exporter
mkdir node
cd node
wget https://github.com/prometheus/node_exporter/releases/download/v0.16.0/node_exporter-0.16.0.linux-amd64.tar.gz

[root@i-u7jq7uyl node]# tar -zxvf node_exporter-0.16.0.linux-amd64.tar.gz
node_exporter-0.16.0.linux-amd64/
node_exporter-0.16.0.linux-amd64/LICENSE
node_exporter-0.16.0.linux-amd64/node_exporter
node_exporter-0.16.0.linux-amd64/NOTICE
[root@i-u7jq7uyl node]# cd node_exporter-0.16.0.linux-amd64
[root@i-u7jq7uyl node_exporter-0.16.0.linux-amd64]# ls -l
total 16524
-rw-r--r-- 1 3434 3434    11357 May 15 23:57 LICENSE
-rwxr-xr-x 1 3434 3434 16900416 May 15 23:53 node_exporter
-rw-r--r-- 1 3434 3434      463 May 15 23:57 NOTICE
启动node_exporter
root@i-u7jq7uyl node_exporter-0.16.0.linux-amd64]# ./node_exporter &
[1] 13139
[root@i-u7jq7uyl node_exporter-0.16.0.linux-amd64]# INFO[0000] Starting node_exporter (version=0.16.0, branch=HEAD,
...
INFO[0000] Listening on :9100                            source="node_exporter.go:111"
修改配file_sd_config和consul_sd_config
修改配置文件
scrape_configs:
  # The job name is added as a label `job=<job_name>` to any timeseries scraped from this config.
  - job_name: 'prometheus'

    # metrics_path defaults to '/metrics'
    # scheme defaults to 'http'.

    static_configs:
      - targets: ['localhost:9090']
  - job_name: node_exporter
    static_configs:
    - targets: ['10.39.43.120:9100']
重新启动prometheus服务
root@i-vzdytl5t prometheus-2.2.1.linux-amd64]# ./prometheus
level=info ts=2018-05-26T10:01:07.958086112Z caller=main.go:220 msg="Starting Prometheus" version="(version=2.2.1, branch=HEAD, revision=bc6058c81272a8d938c05e75607371284236aadc)"
level=info ts=2018-05-26T10:01:07.958196332Z caller=main.go:221 build_context="(go=go1.10, user=root@149e5b3f0829, date=20180314-14:15:45)"
level=info ts=2018-05-26T10:01:07.958225106Z caller=main.go:222 host_details="(Linux 3.10.0-862.3.2.el7.x86_64 #1 SMP Mon May 21 23:36:36 UTC 2018 x86_64 i-vzdytl5t (none))"
level=info ts=2018-05-26T10:01:07.958248443Z caller=main.go:223 fd_limits="(soft=1024, hard=4096)"
level=info ts=2018-05-26T10:01:07.960350104Z caller=main.go:504 msg="Starting TSDB ..."
level=info ts=2018-05-26T10:01:07.961534398Z caller=web.go:382 component=web msg="Start listening for connections" address=0.0.0.0:9090
level=info ts=2018-05-26T10:01:07.988711502Z caller=main.go:514 msg="TSDB started"
level=info ts=2018-05-26T10:01:07.989027171Z caller=main.go:588 msg="Loading configuration file" filename=prometheus.yml
level=info ts=2018-05-26T10:01:07.991016054Z caller=main.go:491 msg="Server is ready to receive web requests."
启动之后
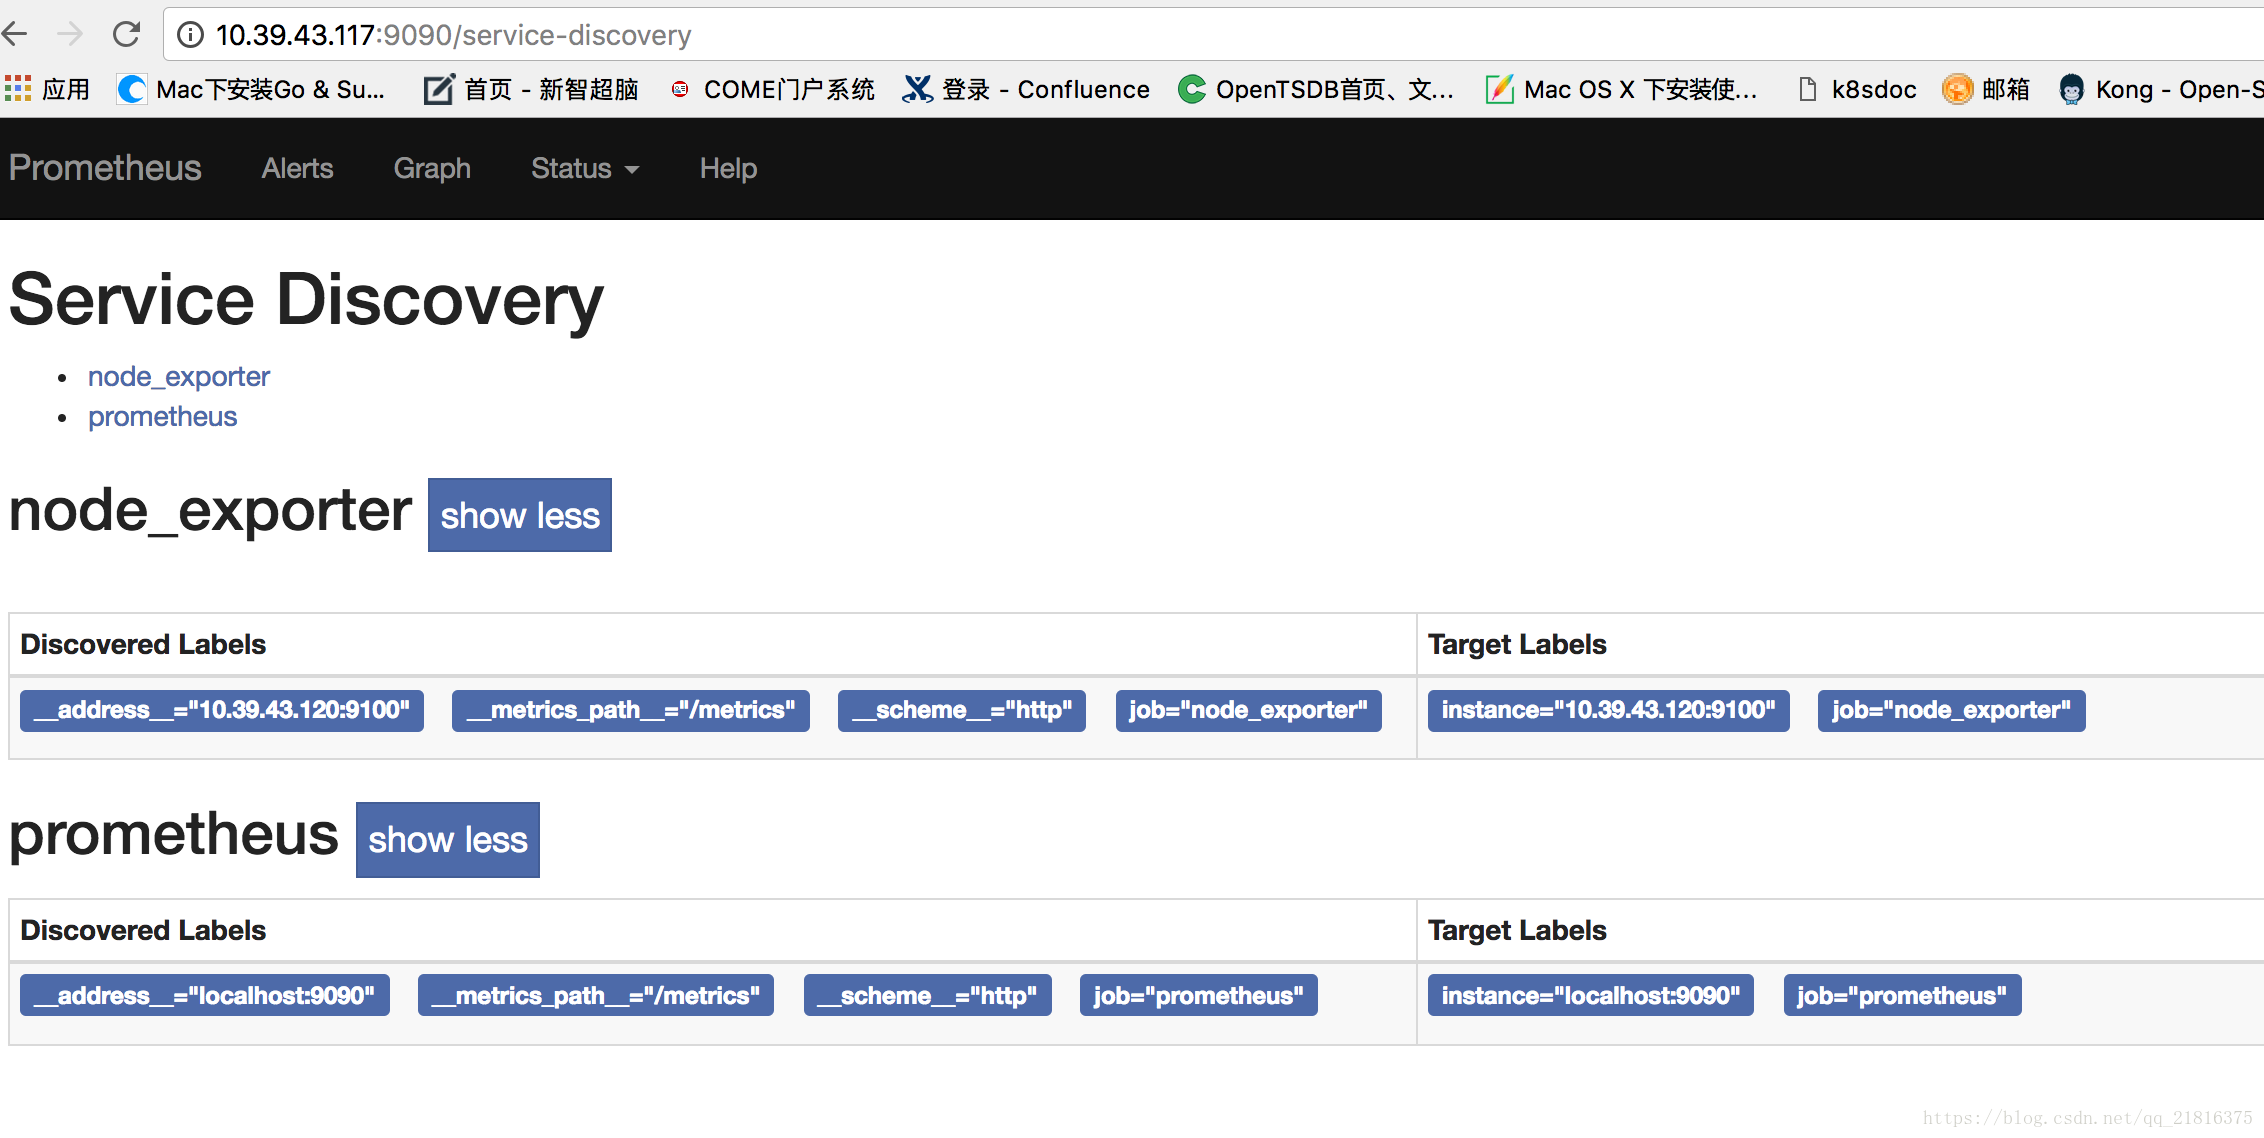
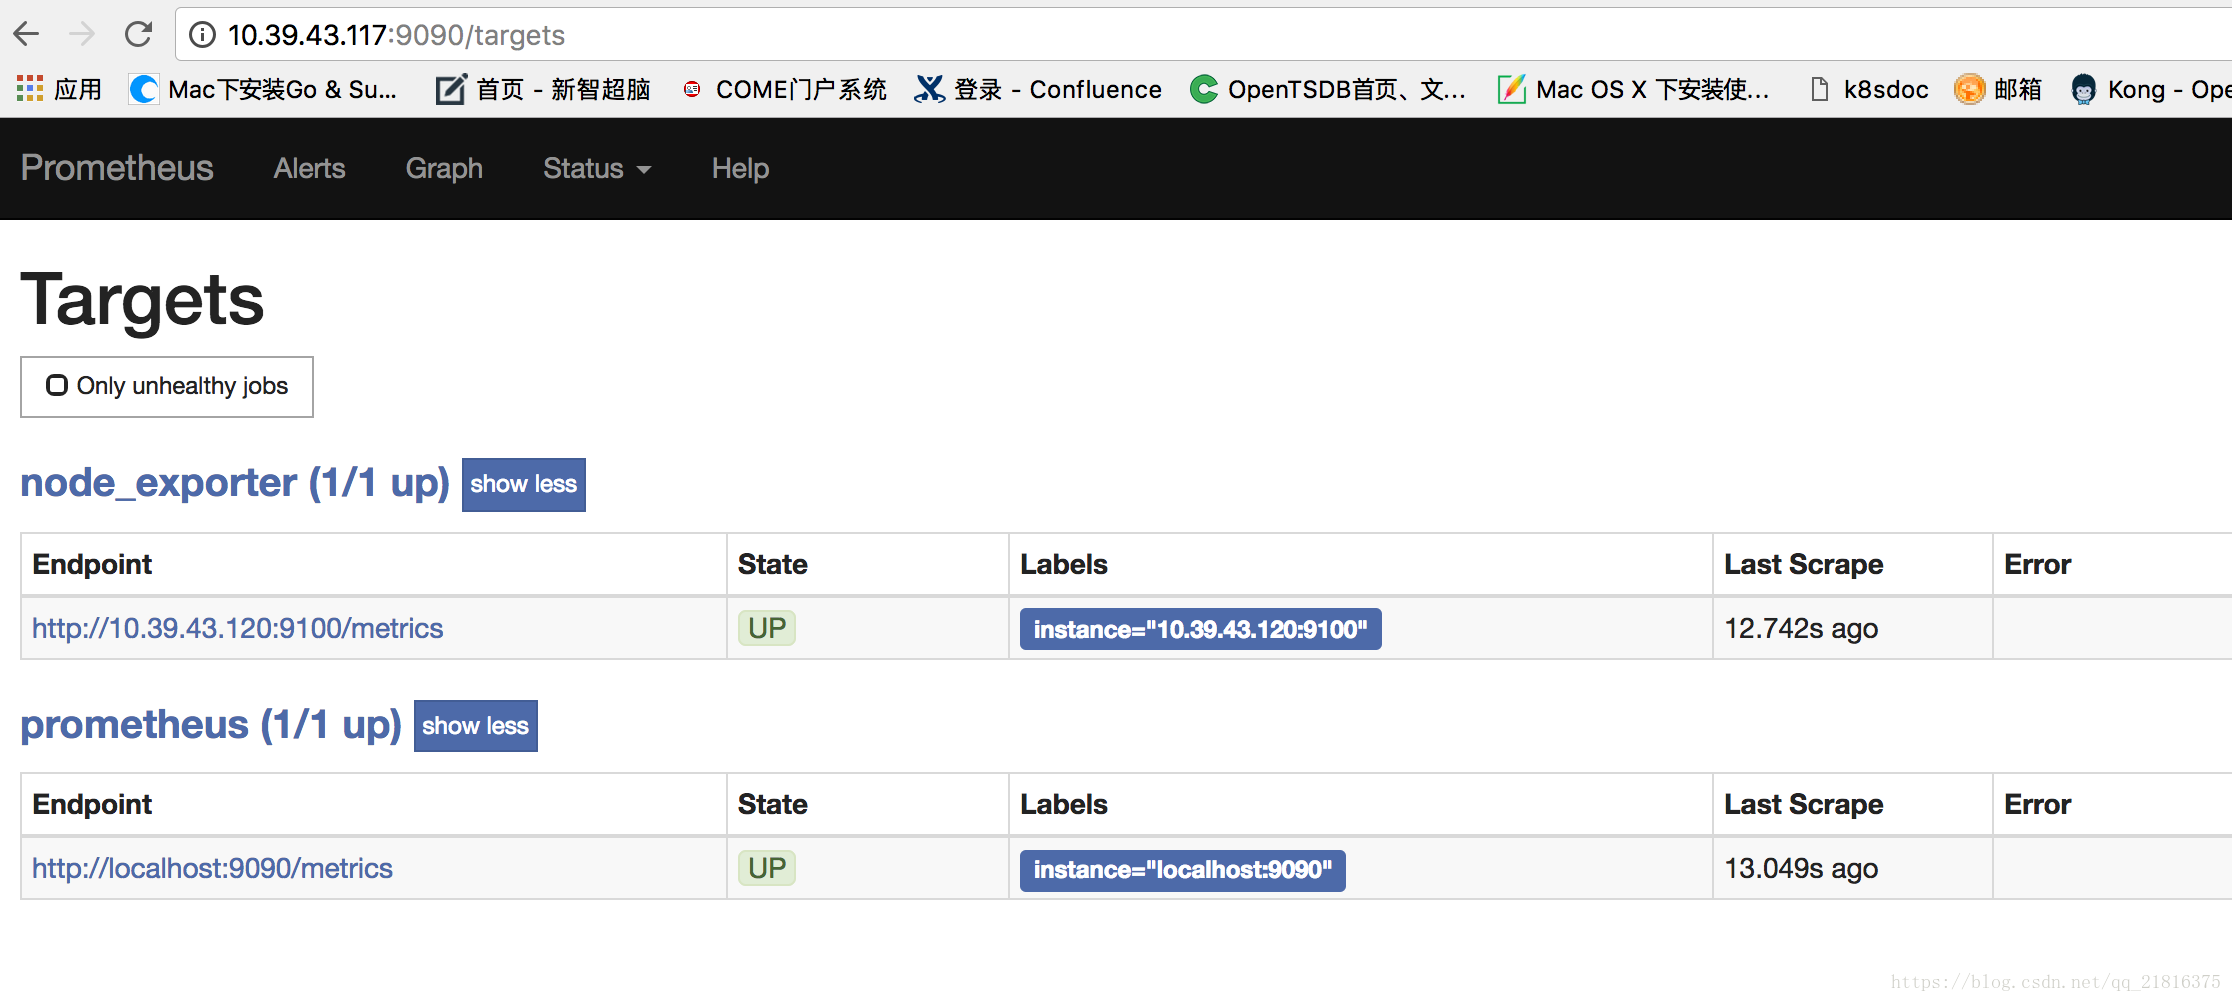
部署监控服务
监控mysql
安装mysql服务
yum install mariadb*
启动mysql
修改mysql root密码:参考链接mysql密码修改
systemctl start mariadb
systemctl status mariadbwget https://github.com/prometheus/mysqld_exporter/releases/download/v0.10.0/mysqld_exporter-0.10.0.linux-amd64.tar.gz
//解压
tar -zvxf mysqld_exporter-0.10.0.linux-amd64.tar.gz修改my.cnf
[root@i-u7jq7uyl mysqld_exporter-0.10.0.linux-amd64]# cat /etc/my.cnf
[mysqld]
datadir=/var/lib/mysql
socket=/var/lib/mysql/mysql.sock
# Disabling symbolic-links is recommended to prevent assorted security risks
symbolic-links=0
# Settings user and group are ignored when systemd is used.
# If you need to run mysqld under a different user or group,
# customize your systemd unit file for mariadb according to the
# instructions in http://fedoraproject.org/wiki/Systemd

[mysqld_safe]
log-error=/var/log/mariadb/mariadb.log
pid-file=/var/run/mariadb/mariadb.pid

#
# include all files from the config directory
#
[client]
host= 0.0.0.0
user= root
password=qinzhao
启动mysqld_exporter
[root@i-u7jq7uyl mysqld_exporter-0.10.0.linux-amd64]# ./mysqld_exporter -config.my-cnf /etc/my.cnf &
[2] 16919
[root@i-u7jq7uyl mysqld_exporter-0.10.0.linux-amd64]# INFO[0000] Starting mysqld_exporter (version=0.10.0, branch=master, revision=80680068f15474f87847c8ee8f18a2939a26196a)  source="mysqld_exporter.go:460"
INFO[0000] Build context (go=go1.8.1, user=root@3b0154cd9e8e, date=20170425-11:24:12)  source="mysqld_exporter.go:461"
INFO[0000] Listening on :9104                            source="mysqld_exporter.go:479"
修改prometheus配置文件,添加以下内容
scrape_configs:
  # The job name is added as a label `job=<job_name>` to any timeseries scraped from this config.
  - job_name: 'prometheus'

    # metrics_path defaults to '/metrics'
    # scheme defaults to 'http'.

    static_configs:
      - targets: ['localhost:9090']
  - job_name: node_exporter
    static_configs:
    - targets: ['10.39.43.120:9100']
  - job_name: 'mysql global status'
    scrape_interval: 15s
    static_configs:
    - targets:
        - 10.39.43.120:9104
    params:
      collect[]:
        - global_status
  - job_name: 'mysql performance'
    scrape_interval: 1m
    static_configs:
      - targets:
        - '10.39.43.120:9104'
    params:
      collect[]:
        - perf_schema.tableiowaits
        - perf_schema.indexiowaits
        - perf_schema.tablelocks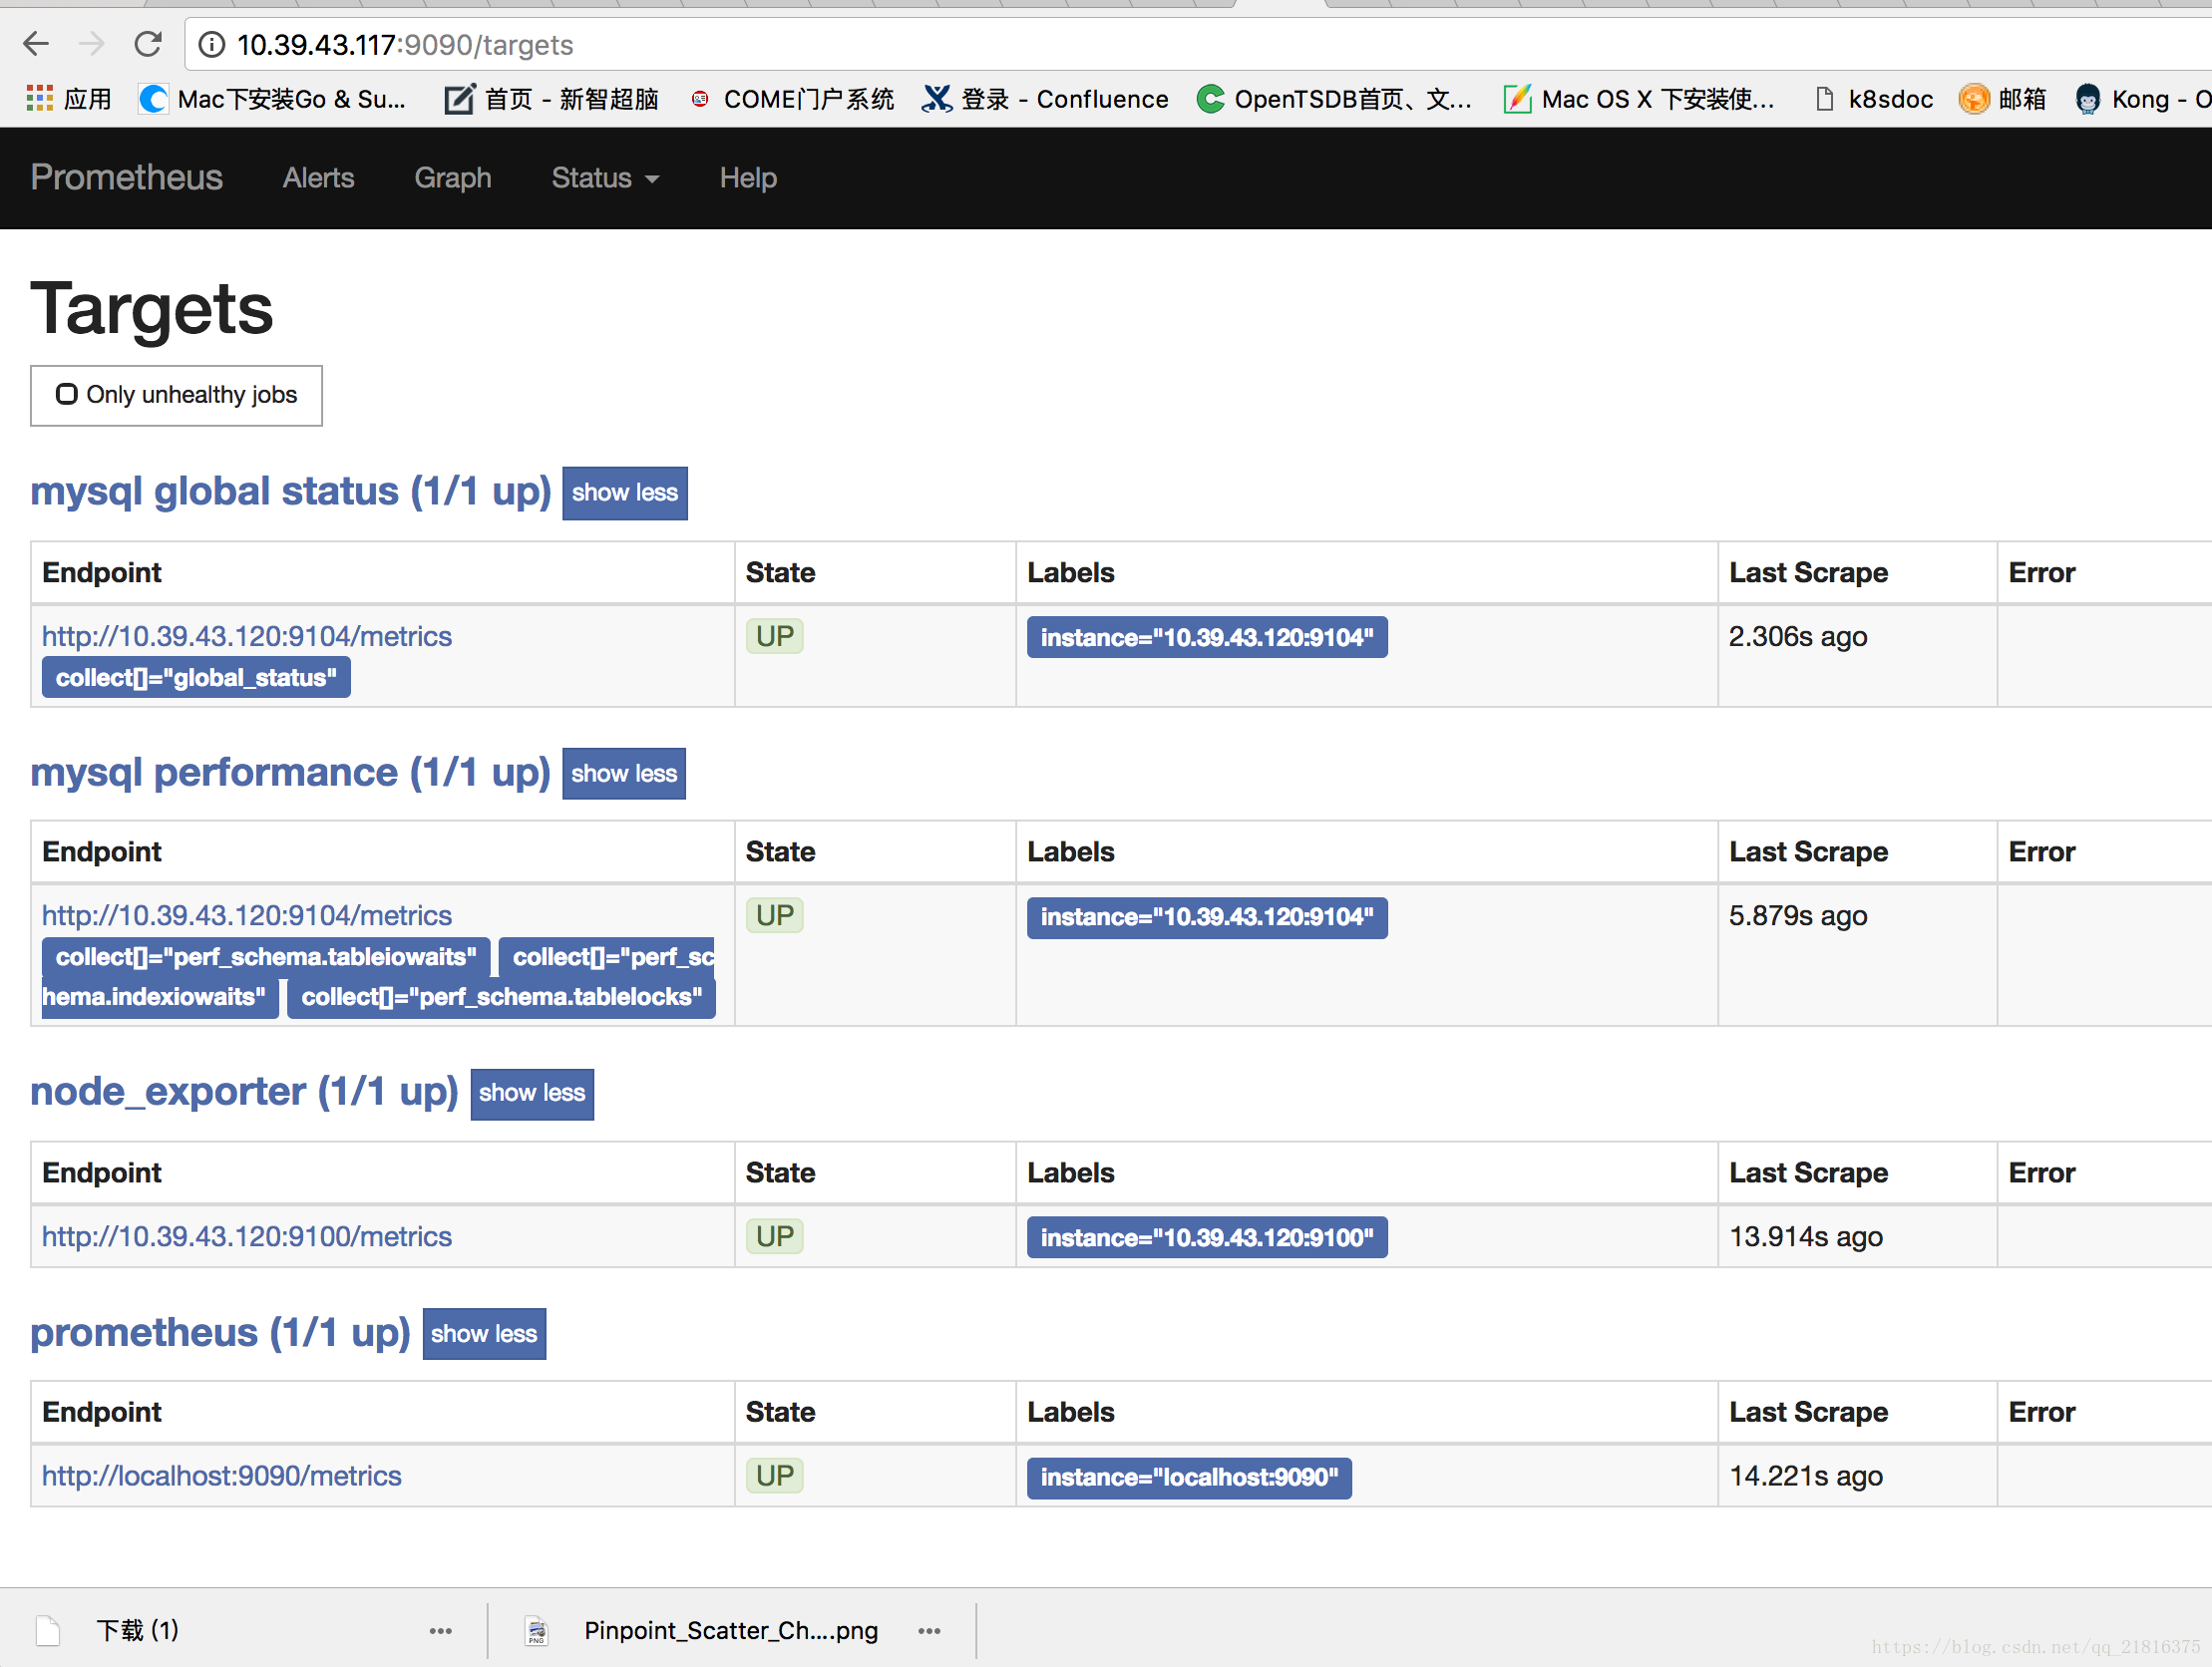
监控redis,redis-export github
安装redis
yum install resdis docker go -y

systemctl enable docker
systemctl start docker
systemctl start redis
启动redis_exporter
docker run -d --name redis_exporter -p 9121:9121 oliver006/redis_exporter
[root@i-u7jq7uyl mysqld_exporter-0.10.0.linux-amd64]# docker ps
CONTAINER ID        IMAGE                      COMMAND                 CREATED             STATUS              PORTS                    NAMES
23f8171fb0af        oliver006/redis_exporter   "/bin/redis_exporter"   3 seconds ago       Up 3 seconds        0.0.0.0:9121->9121/tcp   redis_exporter
prometheus.yaml的文件
scrape_configs:
  # The job name is added as a label `job=<job_name>` to any timeseries scraped from this config.
  - job_name: 'prometheus'

    # metrics_path defaults to '/metrics'
    # scheme defaults to 'http'.

    static_configs:
      - targets: ['localhost:9090']
  - job_name: node_exporter
    static_configs:
    - targets: ['10.39.43.120:9100']
  - job_name: 'mysql global status'
    scrape_interval: 15s
    static_configs:
    - targets:
        - 10.39.43.120:9104
    params:
      collect[]:
        - global_status
  - job_name: 'mysql performance'
    scrape_interval: 1m
    static_configs:
      - targets:
        - '10.39.43.120:9104'
    params:
      collect[]:
        - perf_schema.tableiowaits
        - perf_schema.indexiowaits
        - perf_schema.tablelocks
  - job_name: redis_exporter
    static_configs:
    - targets: ['10.39.43.120:9121']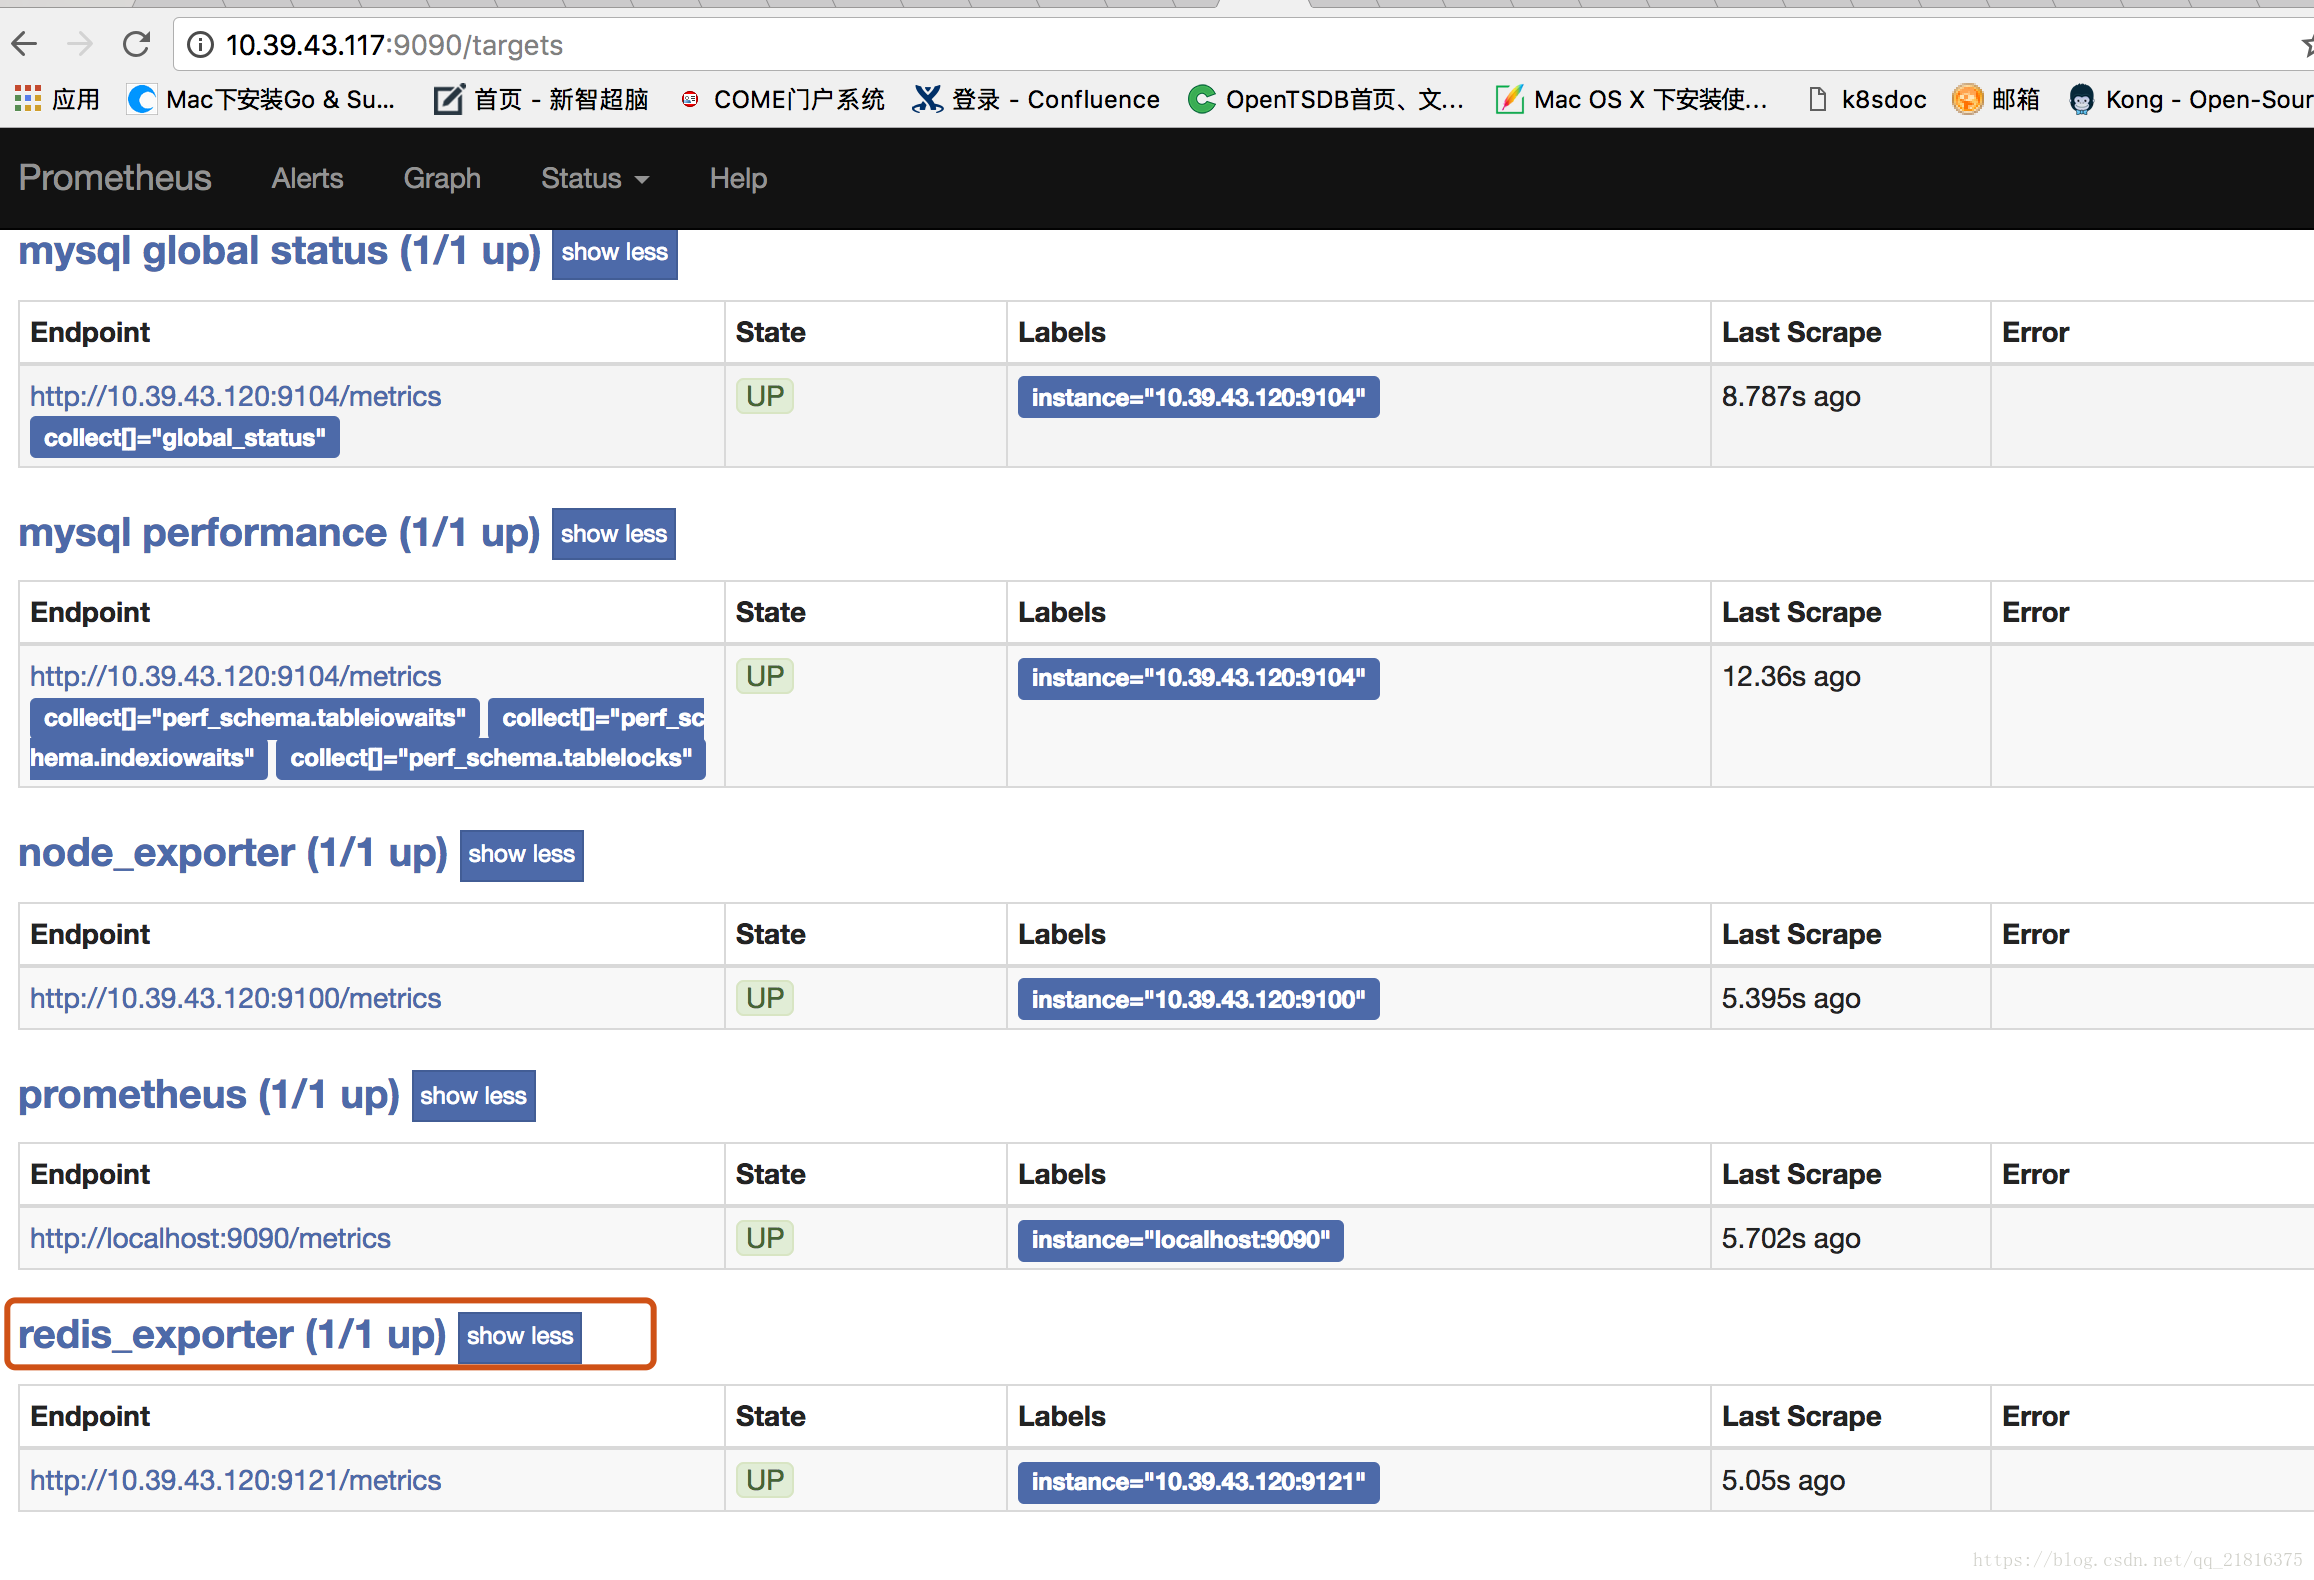
部署监控域名
wget https://github.com/prometheus/blackbox_exporter/releases/download/v0.12.0/blackbox_exporter-0.12.0.linux-amd64.tar.gz

[root@i-u7jq7uyl blackbox]# tar -zxvf blackbox_exporter-0.12.0.linux-amd64.tar.gz
blackbox_exporter-0.12.0.linux-amd64/
blackbox_exporter-0.12.0.linux-amd64/blackbox.yml
blackbox_exporter-0.12.0.linux-amd64/LICENSE
blackbox_exporter-0.12.0.linux-amd64/NOTICE
blackbox_exporter-0.12.0.linux-amd64/blackbox_exporter

cd blackbox_exporter-0.12.0.linux-amd64
修改prometheus配置文件
- job_name: 'blackbox'
    metrics_path: /probe
    params:
      module: [http_2xx]  # Look for a HTTP 200 response.
    static_configs:
    - targets:
      - http://prometheus.io
      - https://prometheus.io
      - http://www.baidu.com
    relabel_configs:
      - source_labels: [__address__]
        target_label: __param_target
      - source_labels: [__param_target]
        target_label: instance
      - target_label: __address__
        replacement: 10.39.43.120:9115
启动blackbox_exporter
root@i-u7jq7uyl blackbox_exporter-0.12.0.linux-amd64]# ./blackbox_exporter --config.file=./blackbox.yml &
[3] 20257
[root@i-u7jq7uyl blackbox_exporter-0.12.0.linux-amd64]# level=info ts=2018-05-26T11:38:16.567749973Z caller=main.go:213 msg="Starting blackbox_exporter" version="(version=0.12.0, branch=HEAD, revision=4a22506cf0cf139d9b2f9cde099f0012d9fcabde)"
level=info ts=2018-05-26T11:38:16.568271598Z caller=main.go:220 msg="Loaded config file"
level=info ts=2018-05-26T11:38:16.56841735Z caller=main.go:324 msg="Listening on address" address=:9115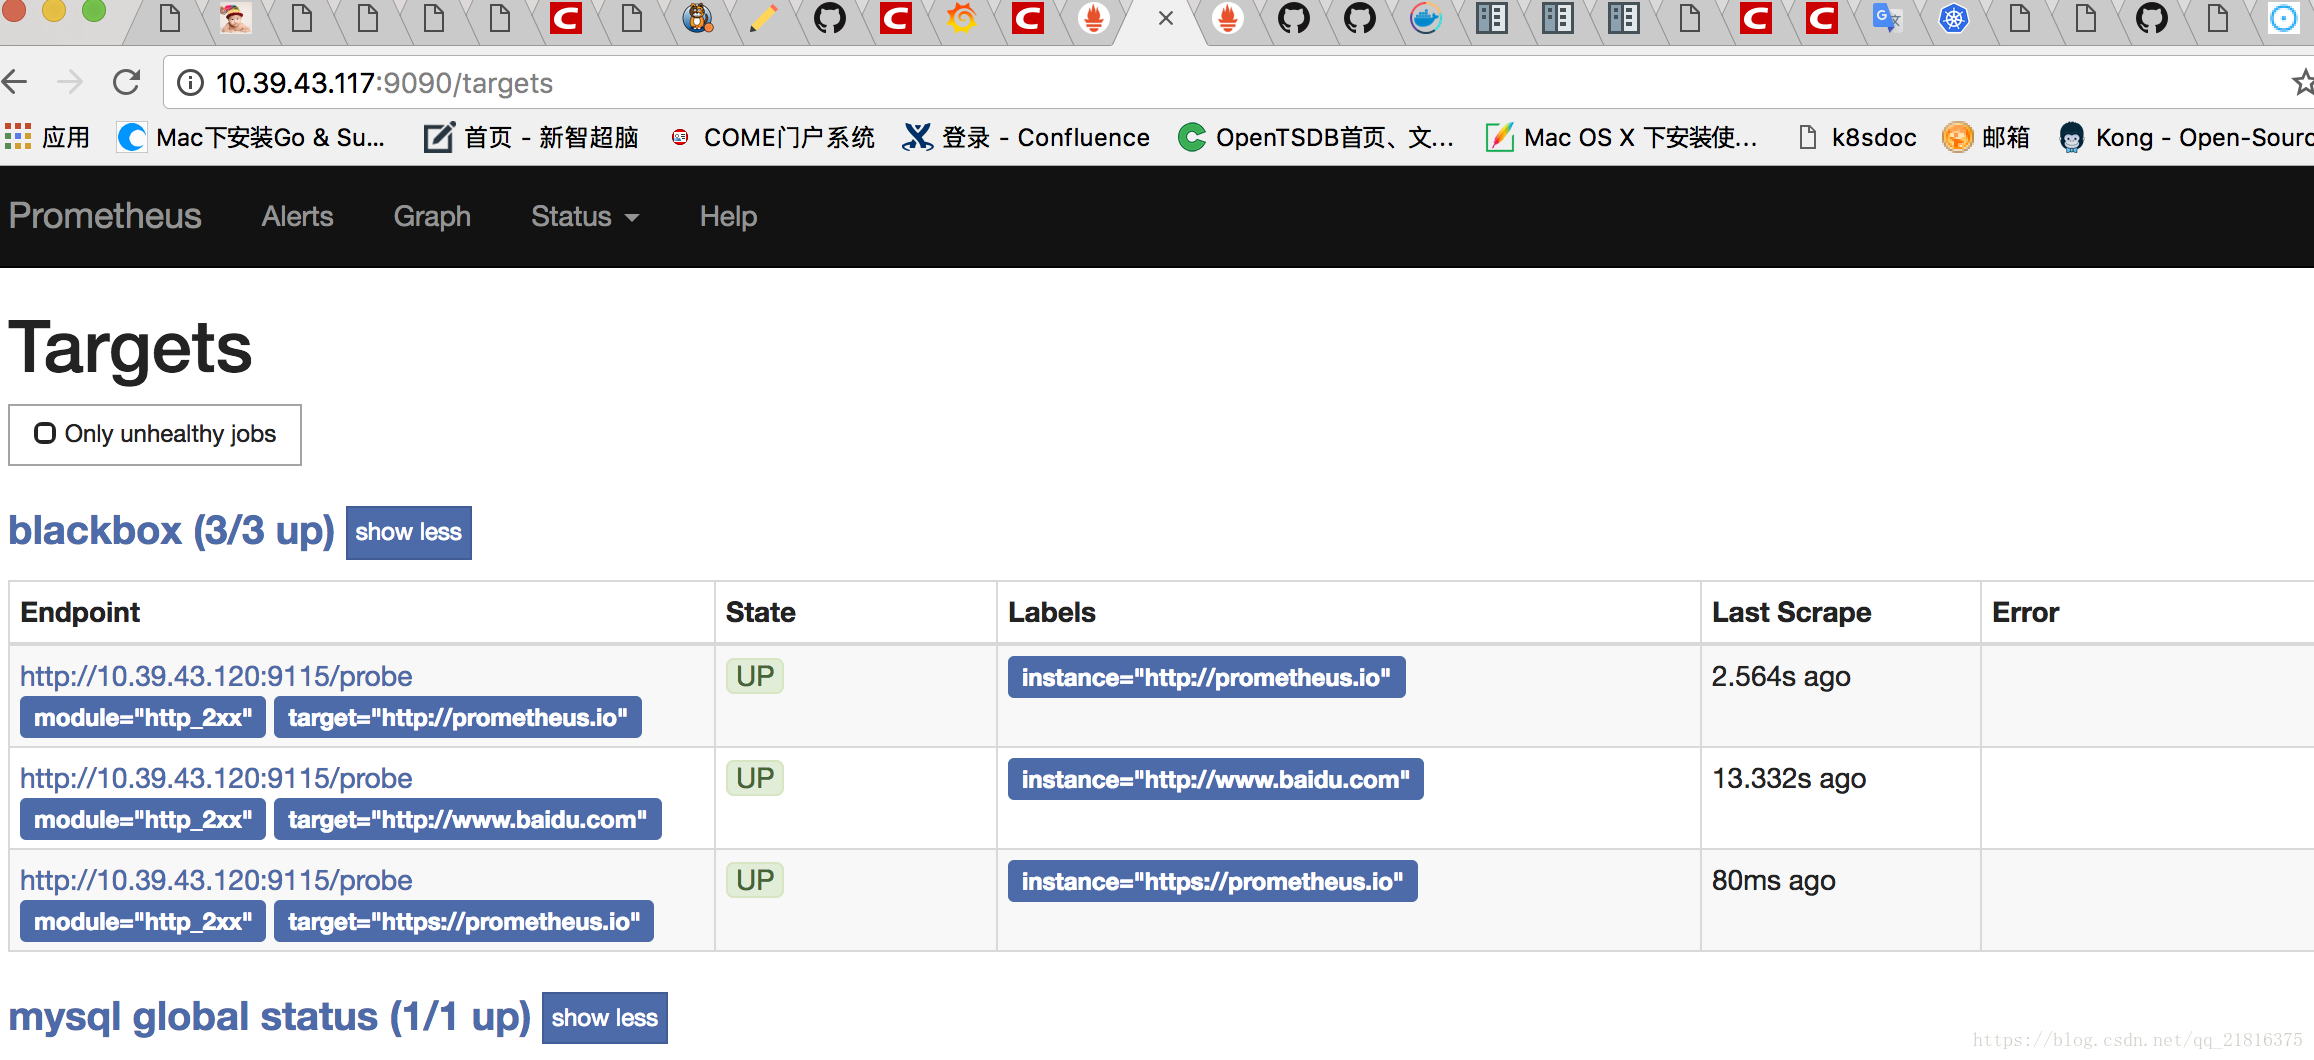
部署告警
下载 github-alert
wget https://github.com/prometheus/alertmanager/releases/download/v0.15.0-rc.1/alertmanager-0.15.0-rc.1.linux-amd64.tar.gz
tar -zxvf alertmanager-0.15.0-rc.1.linux-amd64.tar.gz

[root@i-vzdytl5t prometheus-2.2.1.linux-amd64]# tar -zxvf alertmanager-0.15.0-rc.1.linux-amd64.tar.gz
alertmanager-0.15.0-rc.1.linux-amd64/
alertmanager-0.15.0-rc.1.linux-amd64/simple.yml
alertmanager-0.15.0-rc.1.linux-amd64/LICENSE
alertmanager-0.15.0-rc.1.linux-amd64/NOTICE
alertmanager-0.15.0-rc.1.linux-amd64/alertmanager
alertmanager-0.15.0-rc.1.linux-amd64/amtool
修改prometheus配置文件
# Alertmanager configuration
alerting:
  alertmanagers:
  - static_configs:
    - targets:
      - localhost:9093
启动altermanager
root@i-vzdytl5t alertmanager-0.15.0-rc.1.linux-amd64]# ./alertmanager --config.file=./simple.yml  &
[1] 19066
[root@i-vzdytl5t alertmanager-0.15.0-rc.1.linux-amd64]# level=info ts=2018-05-26T11:46:14.350518977Z caller=main.go:140 msg="Starting Alertmanager" version="(version=0.15.0-rc.1, branch=HEAD, revision=acb111e812530bec1ac6d908bc14725793e07cf3)"
level=info ts=2018-05-26T11:46:14.350611647Z caller=main.go:141 build_context="(go=go1.10, user=root@f278953f13ef, date=20180323-13:05:10)"
level=info ts=2018-05-26T11:46:14.371247513Z caller=cluster.go:249 component=cluster msg="Waiting for gossip to settle..." interval=2s
level=info ts=2018-05-26T11:46:14.371641831Z caller=main.go:270 msg="Loading configuration file" file=./simple.yml
level=info ts=2018-05-26T11:46:14.376896501Z caller=main.go:346 msg=Listening address=:9093
level=info ts=2018-05-26T11:46:16.371508823Z caller=cluster.go:274 component=cluster msg="gossip not settled" polls=0 before=0 now=1 elapsed=2.000127475s