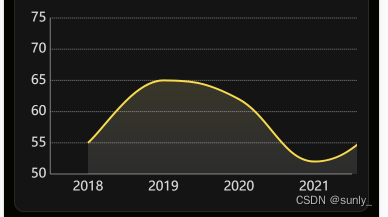
带渐变阴影的曲线图
<view class="charts-box">
	<qiun-data-charts type="area" :opts="opts" :chartData="chartData" :ontouch="true"
		:background="'rgba(256,256,256,0)'" />
</view>
data(){


	return{


		chartData: {

    },
		opts: {


			color: ["#F7DB4D"],
			padding: [20, 5, 4, 0],
			enableScroll: true,
			dataLabel: false,
			dataPointShape: false,
			disableScroll: true,
			fontColor: "#DCDCDC",
			legend: {


				show: false // 不绘制标题
			},
			xAxis: {


				disableGrid: true, // 不绘制纵向网格(即默认绘制网格)
				scrollShow: false, // 不显示滚动条
				itemCount: 4, // x轴显示数据个数
				fontColor: '#DCDCDC',
				axisLineColor: "#828282",
				gridColor: "#828282",
			},
			yAxis: {


				gridType: "dash", // 纵向网格线型,可选值:'solid'实线,'dash'虚线
				dashLength: 2, // 纵向网格为虚线时,单段虚线长度
				gridColor: "#828282",
				data: [{


					position: 'left', // 轴绘制到右侧
					fontColor: '#DCDCDC',
					axisLineColor: "#828282",
				}]
			},
			extra: {


				area: {


					type: "curve", // 曲线圆滑模式
					gradient: true, // 是否开启区域图渐变色
				},
				tooltip: {


					showBox: true,
					showArrow: false,
					gridType: 'dash',
					gridColor: '#F7DB4D'
				}
			}
		}
	}
}
onLoad(option) {


	this.getServerData();
},
methods: {


	getServerData(data, date) {


		//模拟从服务器获取数据时的延时
		setTimeout(() => {


			//模拟服务器返回数据,如果数据格式和标准格式不同,需自行按下面的格式拼接
			let res = {


				categories: ["2018", "2019", "2020", "2021", "2022", "2023"],
				series: [{


					name: "曲线图",
					data: [55, 65, 62, 52, 59, 71]
				}]
			};
			this.chartData = JSON.parse(JSON.stringify(res));
		}, 500);
	},
}
.charts-box {


	position: relative;
	z-index: 2;
	width: 660rpx;
	height: 400rpx;
	margin: auto;
}
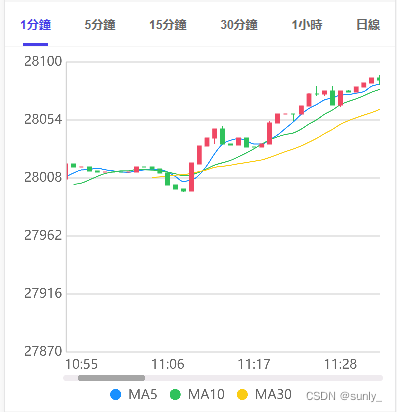
K线图
<view class="charts-box">
	<qiun-data-charts type="candle" :opts="opts" :chartData="chartData" :disableScroll="true" :ontouch="true"
	:onzoom="true" />
</view>
data(){


	return{


		chartData: {

    },
		opts: {


			rotate: false,
			rotateLock: false,
			color: ["#1890FF", "#91CB74", "#FAC858", "#EE6666", "#73C0DE", "#3CA272", "#FC8452", "#9A60B4",
				"#ea7ccc"
			],
			padding: [15, 15, 0, 15],
			dataLabel: false,
			enableScroll: true,
			enableMarkLine: true,
			legend: {

    },
			xAxis: {


				labelCount: 4,
				itemCount: 40,
				disableGrid: true,
				gridColor: "#CCCCCC",
				gridType: "solid",
				dashLength: 4,
				scrollShow: true,
				scrollAlign: "left",
				scrollColor: "#A6A6A6",
				scrollBackgroundColor: "#EFEBEF"
			},
			yAxis: {

    },
			extra: {


				candle: {


					color: {


						upLine: "#f04864",
						upFill: "#f04864",
						downLine: "#2fc25b",
						downFill: "#2fc25b"
					},
					average: {


						show: true,
						name: [
							"MA5",
							"MA10",
							"MA30"
						],
						day: [
							5,
							10,
							20
						],
						color: [
							"#1890ff",
							"#2fc25b",
							"#facc14"
						]
					}
				},
				markLine: {


					type: "dash",
					dashLength: 5,
					data: [{


							value: 2150,
							lineColor: "#f04864",
							showLabel: true
						},
						{


							value: 2350,
							lineColor: "#f04864",
							showLabel: true
						}
					]
				},
				tooltip: {


					showCategory: true
				}
			}
		},
	}
}
onReady() {


	this.getServerData()
},
methods:{


	getServerData(date, data) {


		// 这里实际测试中,要向时间数据最后push4个空数据,防止时间出现堆在一起的情况
		date.push('')
		date.push('')
		date.push('')
		date.push('')
		//模拟服务器返回数据,如果数据格式和标准格式不同,需自行按下面的格式拼接
		let res = {


			categories: ['2020-01-02','2020-01-03'], // date
			series: [{


				name: "上证指数",
				data: [ // data
					[1,2,3,4],
					[1,2,3,4],
				]
			}]
		};
		this.chartData = JSON.parse(JSON.stringify(res));
	},
}
进度条

<template>
	<view class="charts-box">
		<qiun-data-charts type="arcbar" :opts="opts" :chartData="chartData" />
	</view>
</template>
<script>
	export default {


		data() {


			return {


				chartData: {

      },
				opts: {


					color: ["#F7DB4D"],
					padding: undefined,
					title: {


						name: "综合",
						fontSize: 20,
						color: "#fff"
					},
					subtitle: {


						name: "运势",
						fontSize: 20,
						color: "#fff"
					},
					extra: {


						arcbar: {


							type: "default",
							width: 12,
							backgroundColor: "#1C1C1C",
							startAngle: 0.75,
							endAngle: 0.25,
							gap: 2,
							linearType: "none"
						}
					}
				}
			}
		},
		onLoad(option) {


			this.getServerData();
		},
		methods: {


			getServerData() {


				//模拟从服务器获取数据时的延时
				setTimeout(() => {


					//模拟服务器返回数据,如果数据格式和标准格式不同,需自行按下面的格式拼接
					let res = {


						series: [{


							name: "综合运势",
							color: "#F7DB4D",
							data: .9
						}]
					};
					this.chartData = JSON.parse(JSON.stringify(res));
				}, 500);
			},
		},
	}
</script>