赛题地址:AI量化模型预测挑战赛
数据集结构如下:

1 CatBoost方法 个人解读
1.1 导入模块
导入所需的模块
import numpy as np
import pandas as pd
from catboost import CatBoostClassifier
from sklearn.model_selection import StratifiedKFold, KFold, GroupKFold
from sklearn.metrics import accuracy_score, f1_score, roc_auc_score, log_loss, mean_squared_log_error
import tqdm, sys, os, gc, argparse, warnings
warnings.filterwarnings('ignore')
- CatBoost是一种基于对称决策树(oblivious trees)算法的参数少、支持类别型变量和高准确性的GBDT框架。深入理解CatBoost - 知乎 (zhihu.com)
warnings.filterwarnings('ignore'):警告过滤器用于控制警告消息的行为,如忽略,显示或转换为错误(引发异常),警告过滤器维护着一个有序的过滤规则列表,匹配规则用于确定如何处理警告,任何特定警告都将依次与列表中的每个过滤规则匹配,直到找到匹配为止。python之warnings模块(warnings.filterwarnings(“ignore”)代码解析) - 习久性成 - 博客园 (cnblogs.com)
1.2 数据探索
数据探索性分析,是通过了解数据集,了解变量间的相互关系以及变量与预测值之间的关系,从而帮助我们后期更好地进行特征工程和建立模型,是机器学习中十分重要的一步。
1.2.1 读取数据
# 读取数据
path = 'AI量化模型预测挑战赛公开数据/'

train_files = os.listdir(path+'train')
train_df = pd.DataFrame()
for filename in tqdm.tqdm(train_files):
    tmp = pd.read_csv(path+'train/'+filename)
    tmp['file'] = filename
    train_df = pd.concat([train_df, tmp], axis=0, ignore_index=True)

test_files = os.listdir(path+'test')
test_df = pd.DataFrame()
for filename in tqdm.tqdm(test_files):
    tmp = pd.read_csv(path+'test/'+filename)
    tmp['file'] = filename
    test_df = pd.concat([test_df, tmp], axis=0, ignore_index=True)
os.listdir(path+'train'): os.listdir() 方法用于返回指定的文件夹包含的文件或文件夹的名字的list列表,和之前看的glob不太一样,glob返回的是路径。python中os.listdir( )函数读取文件夹 - Rogn - 博客园 (cnblogs.com)train_df = pd.concat([train_df, tmp], axis=0, ignore_index=True):将train_df和tmp这两个数据框沿着行方向(axis=0)进行拼接,tmp中的数据添加到train_df的末尾,并忽略原始索引。pandas数据合并之pd.concat()用法_xue_11的博客-CSDN博客
pandas数据合并之一文弄懂pd.concat() - 知乎 (zhihu.com)
1.2.2 可视化分析
对买价卖价进行可视化分析
选择任意一个股票数据进行可视化分析,观察买价和卖价的关系。下面是对买价和卖价的简单介绍:
- 买价指的是买方愿意为一项股票/资产支付的最高价格。
- 卖价指的是卖方愿意接受的一项股票/资产的最低价格。
- 这两个价格之间的差异被称为点差;点差越小,该品种的流动性越高。
cols = ['n_bid1','n_bid2','n_ask1','n_ask2']
tmp_df = train_df[train_df['file']=='snapshot_sym7_date22_pm.csv'].reset_index(drop=True)[-500:]
tmp_df = tmp_df.reset_index(drop=True).reset_index()
for num, col in enumerate(cols):
    plt.figure(figsize=(20,5))

    plt.subplot(4,1,num+1)
    plt.plot(tmp_df['index'],tmp_df[col])
    plt.title(col)
plt.show()
plt.figure(figsize=(20,5))

for num, col in enumerate(cols):
    plt.plot(tmp_df['index'],tmp_df[col],label=col)
plt.legend(fontsize=12)
train_df[train_df['file']=='snapshot_sym7_date22_pm.csv']:从train_df的数据框中筛选出file列的值为snapshot_sym7_date22_pm.csv的行。reset_index(drop=True):用于将数据框的索引列重新设置为默认的整数索引,并删除原来的索引列。参数drop=True表示在重置索引时删除原来的索引列,而不是将其添加为新的列。enumerate(iterable, start=0):iterable表示要遍历的可迭代对象,start表示索引的起始值返回一个枚举对象。可以使用for循环来遍历该对象。在每次迭代中,它会返回一个包含两个元素的元组,第一个元素是当前元素的索引,第二个元素是对应的元素值。plt.figure(figsize=(20,5)):创建一个新的图形窗口,设置其大小为20x5英寸。plt.subplot(4,1,num+1):在当前图形窗口中创建一个子图,参数4,1表示将图形窗口分为4行1列,然后选择第num+1个子图进行绘制。plt.plot(tmp_df['index'],tmp_df[col],label=col):在当前图上绘制一条线,使用label参数为这条线添加标签。plt.legend(fontsize=12):在图形窗口中添加图例,图例的内容是每个子图的标签。通过设置fontsize参数,可以调整图例字体的大小,上面就是用的12号字体。

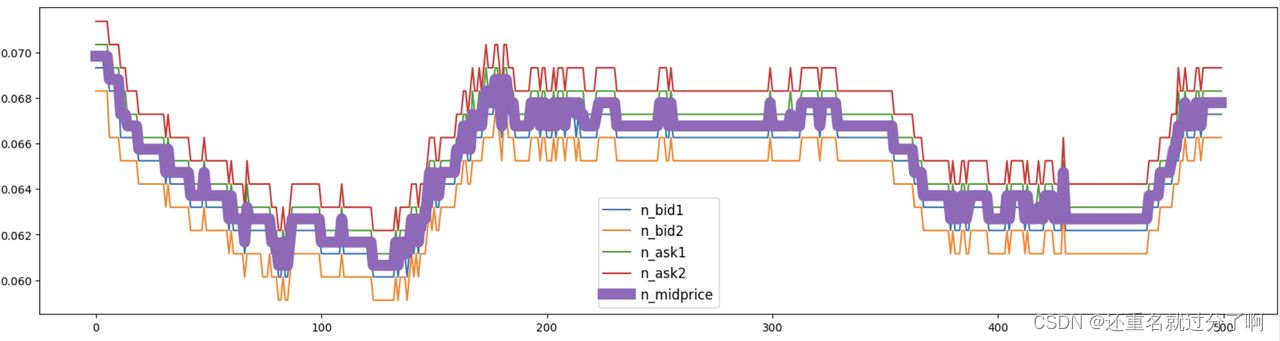
中间价可视化
中间价即买价与卖价的均值,数据中有直接给到,我们也可以自己计算。
plt.figure(figsize=(20,5))

for num, col in enumerate(cols):

    plt.plot(tmp_df['index'],tmp_df[col],label=col)

plt.plot(tmp_df['index'],tmp_df['n_midprice'],label="n_midprice",lw=10)
plt.legend(fontsize=12)
lw=10:lw是matplotlib库中plot函数的一个参数,用于设置线条的线宽。
加权平均价格(WAP)可视化
波动率是给定股票价格变化的重要统计指标,因此要计算价格变化,我们首先需要在固定间隔进行股票估值。我们将使用已提供的数据的加权平均价格(WAP)进行可视化,WAP的变化反映股票波动情况。
train_df['wap1'] = (train_df['n_bid1']*train_df['n_bsize1'] + train_df['n_ask1']*train_df['n_asize1'])/(train_df['n_bsize1'] + train_df['n_asize1'])
test_df['wap1'] = (test_df['n_bid1']*test_df['n_bsize1'] + test_df['n_ask1']*test_df['n_asize1'])/(test_df['n_bsize1'] + test_df['n_asize1'])

tmp_df = train_df[train_df['file']=='snapshot_sym7_date22_pm.csv'].reset_index(drop=True)[-500:]
tmp_df = tmp_df.reset_index(drop=True).reset_index()
plt.figure(figsize=(20,5))
plt.plot(tmp_df['index'], tmp_df['wap1'])
- 主要是DataFrame的运算。数据分析之Pandas(四)DataFrame运算_python pandas 表内运算_提莫君的博客-CSDN博客
![[Pasted image 20230806000855.png]]
1.3 特征工程
在特征工程阶段,构建基本的时间特征,提取小时、分钟等相关特征,主要是为了刻画不同时间阶段可能存在的差异性信息。需要注意数据是分多个文件存储的,所以需要进行文件合并,然后在进行后续的工作。
# 时间相关特征
train_df['hour'] = train_df['time'].apply(lambda x:int(x.split(':')[0]))
test_df['hour'] = test_df['time'].apply(lambda x:int(x.split(':')[0]))

train_df['minute'] = train_df['time'].apply(lambda x:int(x.split(':')[1]))
test_df['minute'] = test_df['time'].apply(lambda x:int(x.split(':')[1]))

# 入模特征
cols = [f for f in test_df.columns if f not in ['uuid','time','file']]
train_df['hour'] = train_df['time'].apply(lambda x:int(x.split(':')[0])):对time_df的time列的每一个元素,利用“ : ”进行分割,例如12:30就变成了["12","30"],第一个就是小时,第二个是分钟,再转化为int类型。
1.4 模型训练与验证
选择使用CatBoost模型,也是通常作为机器学习比赛的基线模型,在不需要过程调参的情况下也能得到比较稳定的分数。这里使用五折交叉验证的方式进行数据切分验证,最终将五个模型结果取平均作为最终提交。
def cv_model(clf, train_x, train_y, test_x, clf_name, seed = 2023):
    folds = 5
    kf = KFold(n_splits=folds, shuffle=True, random_state=seed)
    oof = np.zeros([train_x.shape[0], 3])
    test_predict = np.zeros([test_x.shape[0], 3])
    cv_scores = []

    for i, (train_index, valid_index) in enumerate(kf.split(train_x, train_y)):
        print('************************************ {} ************************************'.format(str(i+1)))
        trn_x, trn_y, val_x, val_y = train_x.iloc[train_index], train_y[train_index], train_x.iloc[valid_index], train_y[valid_index]

        if clf_name == "cat":
            params = {

    'learning_rate': 0.2, 'depth': 6, 'bootstrap_type':'Bernoulli','random_seed':2023,
                      'od_type': 'Iter', 'od_wait': 100, 'random_seed': 11, 'allow_writing_files': False,
                      'loss_function': 'MultiClass'}

            model = clf(iterations=5000, **params)
            model.fit(trn_x, trn_y, eval_set=(val_x, val_y),
                      metric_period=1000,
                      use_best_model=True,
                      cat_features=[],
                      verbose=1)

            val_pred  = model.predict_proba(val_x)
            test_pred = model.predict_proba(test_x)

        oof[valid_index] = val_pred
        test_predict += test_pred / kf.n_splits

        F1_score = f1_score(val_y, np.argmax(val_pred, axis=1), average='macro')
        cv_scores.append(F1_score)
        print(cv_scores)

    return oof, test_predict

for label in ['label_5','label_10','label_20','label_40','label_60']:
    print(f'=================== {

      label} ===================')
    cat_oof, cat_test = cv_model(CatBoostClassifier, train_df[cols], train_df[label], test_df[cols], 'cat')
    train_df[label] = np.argmax(cat_oof, axis=1)
    test_df[label] = np.argmax(cat_test, axis=1)
kf = KFold(n_splits=folds, shuffle=True, random_state=seed):
KFold是sklearn库中的一个类,用于将数据集划分为k个连续的折叠(folds)。每个折叠可以被用作验证集,其余的折叠作为训练集。这种方法常用于交叉验证中。
n_splits=folds表示将数据集划分为folds个折叠。
shuffle=True表示在划分之前,先对数据集进行随机打乱。
random_state=seed表示设置随机数种子,以确保每次运行代码时,数据集的划分方式都是一样的。kf.split(train_x, train_y):使用KFold对象kf,将数据集划分为训练集和验证集,返回值是一个包含两个元素的元组,每个元素是包含特征数据和标签数据的索引数组。iloc[list]:iloc可以接受索引数组,返回需要的那几行数据。如何在pandas中使用loc、iloc函数进行数据索引(入门篇) - 知乎 (zhihu.com)clf(iterations=5000, **params):params前面两个*,代表关键字参数,允许传入0个或任意个含参数名的参数,这些关键字参数在函数内部自动组装为一个dict。python函数参数传递(params, * params, ** params)_ params python_Chercheer的博客-CSDN博客f1_score(val_y, np.argmax(val_pred, axis=1), average='macro'):val_y是验证集的真实标签,np.argmax(val_pred, axis=1)是模型对验证集进行预测后得到的每个样本的预测类别索引。然后,使用average='macro'参数表示对所有样本的F1分数取平均值。sklearn.metrics.f1_score 使用方法_壮壮不太胖^QwQ的博客-CSDN博客
本次比赛采用macro-F1 score进行评价,取label_5, label_10, label_20, label_40, label_60五项中的最高分作为最终得分,所以在初次建模的时候对应五个目标都需要进行建模,确定分数最高的目标,之后进行优化的时候仅需对最优目标进行建模即可,大大节省时间,聚焦单个目标优化。
1.5 结果输出
提交结果需要符合提交样例结果,然后将文件夹进行压缩成zip格式提交。
import pandas as pd
import os

# 指定输出文件夹路径
output_dir = './submit'

# 如果文件夹不存在则创建
if not os.path.exists(output_dir):
    os.makedirs(output_dir)

# 首先按照'file'字段对 dataframe 进行分组
grouped = test_df.groupby('file')

# 对于每一个group进行处理
for file_name, group in grouped:
    # 选择你所需要的列
    selected_cols = group[['uuid', 'label_5', 'label_10', 'label_20', 'label_40', 'label_60']]

    # 将其保存为csv文件,file_name作为文件名
    selected_cols.to_csv(os.path.join(output_dir, f'{

      file_name}'), index=False)
grouped = test_df.groupby('file'):将test_df数据框按照file列的值进行分组,grouped变量是一个字典,其中键是file列的不同值,而值则是对应的子数据框(DataFrame)。可以使用grouped.groups属性来查看所有的分组名称,使用grouped['file'].unique()可以查看所有的唯一文件名。
2 个人总结
- 首先是认识到了一些语法,以及一些函数的用法,比如
groupby、f1_score、subplot、KFold、listdir。希望在之后的学习中,一点一点熟悉它们,最后能够学以致用,大大提高效率。 - 认识了CatBoost决策树,但是具体原理并不清楚,我打算先学会用再去探索原理。
- 学习了一些特征构造方法。