步骤1:
安装echarts :npm install echarts ( 如果报错安装具体版本试试 )
安装echarts-liquidfill :npm install [email protected] (我这里安装是1.0.5版本)
安装成功 项目文件的package.json文件夹里会显示具体安装的内容

步骤2 :
全局或局部引入npm包
具体代码:
import * as echarts from "echarts";
import "echarts-gl";
import 'echarts-liquidfill'

步骤三:
代码:
(不要忘了给div设置宽高)
<div id="devChart" class='devChart'></div>

Hydrograph () {
let chart = this.$echarts.init(document.getElementById('devChart'))
window.addEventListener('resize', function () {chart.resize()})
chart.setOption({
title: {
show: true,
x: '50%',
y: '60%',
z: 10,
textAlign: 'center', // 文字位置
textStyle: { // 文字样式设置
color: '#ffffff',
fontSize: 50,
fontWeight: 500
},
},
series: [{
name: '水波图',
type: 'liquidFill',
radius: '60%',
center: ['50%', '45%'],
data: [
{
value: [55.2 / 100],
label: {
normal: {
formatter: `${55.2}%`,
show: true,
}
}
}
],
label:{
normal:{
textStyle:{ // 数值样式设置
color: '#ffffff',
fontSize: 60,
}
}
},
color: [
{
type: 'linear',
x: 0,
y: 1,
x2: 0,
y2: 0,
colorStops: [ // 水波颜色渐变
{
offset: 1,
color: ['rgba(11,175,202,1)'], // 0% 处的颜色
},
{
offset: 0,
color: ['rgba(0,145,255,1)'], // 100% 处的颜色
}
], // 水波纹颜色
}
],
backgroundStyle: {
color: 'rgba(39,115,229,0.12)'
},
outline: {
borderDistance: 0,
itemStyle: {
borderWidth: 5, // 边 宽度
borderColor: 'rgba(49,102,255,0.5)',
}
},
}]
})
},
最后调用该函数
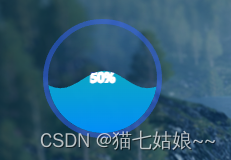
效果如下:
-------------------------------------------------完结撒花-------------------------------------------------------------------