Yolov5实现视频中的指针式仪表读数 [python]
背景:根据巡航机器人拍摄的视频,读出其中两个电流表和两个电压表的度数。
Yolov5
Yolov5的star数高达37.5k,是Yolo系列最为经典的版本。本项目在Yolov5 v5.0的基础上进行修改,来实现指针式仪表的读数功能。
prepare
数据集:对机器人拍摄的视频进行抽帧标注。
标注工具:labelImg
预训练权重:yolov5s.pt
环境:pip install -i https://pypi.tuna.tsinghua.edu.cn/simple -r requirements.txt
指针式仪表
整体思路
注:(train过程省略)
- 通过sftp协议从服务器下载机器人拍摄的视频;
- 当同时检测到四个表时才进行保存;
- 表的位置确定:通过重新排列label标签标注表的位置(0、1、2、3);
- 找到检测过程中最清晰的四张表:通过分别计算各个表的Laplacian,得到最清晰的表图像;
- 在检测完毕时,将最清晰的四张表存放在clock文件夹中;
- 利用OpenCV中的Canny算子进行图像的边缘检测,识别指针和零刻度线,计算角度得出度数。
- 通过接口发送到服务器。
1. 从远程服务器下载视频
getVideo:
import paramiko
import os
# 从服务器获取视频
HOST_IP = '10.16.42.172'  # 服务器地址
PORT = 8989  // 端口
REMOTE_PATH = '/home/eini/SG/water'  # 视频在服务器的位置
REMOTE_FILENAME = 'cut4.mp4'  # 文件名
LOCAL_PATH = './video'  # 存放本地位置
USERNAME = 'root'  # 登录服务器用户名
PASSWORD = '123456'  # 登录服务器密码

def remote_scp(host_ip, remote_path, local_path, file_name, username, password):
    t = paramiko.Transport((host_ip, PORT))
    t.connect(username=username, password=password)  # 登录远程服务器
    sftp = paramiko.SFTPClient.from_transport(t)  # sftp传输协议
    src = remote_path + '/' + file_name
    des = local_path + '/' + file_name
    sftp.get(src, des)
    t.close()
detect.py:
parser.add_argument('--host_ip', default='10.16.42.172', help='')
parser.add_argument('--port', default=8989, help='')
parser.add_argument('--remote_path', default='/home/eini/SG/water', help='')
parser.add_argument('--remote_filename', default='cut1.mp4', help='')
parser.add_argument('--local_path', default='./video', help='')
parser.add_argument('--username', default='root', help='')
parser.add_argument('--password', default='123456', help='')
remote_scp(opt.host_ip, opt.remote_path, opt.local_path, opt.remote_filename, opt.username, opt.password)
2. 检测仪表
设置变量num_clock记录当前检测目标的数目,当if num_clock == 4:时进行后续操作。
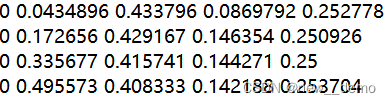
3. 重新排列label标签
此操作是为了对四个表进行标号,根据label标签中的x坐标,从左到右将仪表标为(0、1、2、3)。
detcet.py:
# txt_path用来存放标签信息的文件夹
sorted_label_path = txt_path + '_sorted' + '.txt'
with open(label_path, 'r') as first_file:
    rows = first_file.readlines()
    sorted_rows = sorted(rows, key=lambda x: float(x.split()[1]), reverse=False)
    with open(sorted_label_path, 'w') as second_file:
        for row in sorted_rows:
            second_file.write(row)
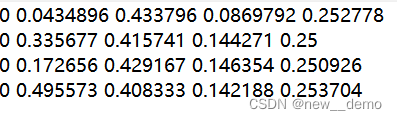
labels文件夹:
cut1_64.txt注:一共有5列信息,分别为 class、x、y、w、h
cut1_64_sorted.txt
4. 计算拉普拉斯算子,得到最清晰的四张表
注:这个步骤也可以通过直接计算长和宽像素值进行代替
# 事先声明清晰度数组,用来存放比较清晰度值
sharpness_original = [0, 0, 0, 0]  # 清晰度数组


# 读取图像
cv2.imwrite(filename_last, roi)
# 计算清晰度
img = cv2.imread(filename_last)
gray = cv2.cvtColor(img, cv2.COLOR_BGR2GRAY)
sharpness = cv2.Laplacian(gray, cv2.CV_64F).var()
print("清晰度值:", sharpness, sharpness_original[n])
if sharpness > sharpness_original[n]:
    sharpness_original[n] = sharpness
    cv2.imwrite(clock_name, roi)
5. 检测完毕后的四张表
将清晰度最高的四张表存放在clock文件夹中,以便于后续读数。
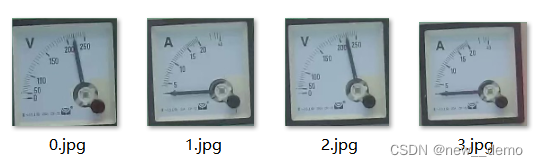
6. 读数
注:本项目中的仪表刻度盘为不均匀分布,后续需要对角度划分进行优化。
将仪表内边框的上边线作为零刻度线的辅助线,通过计算辅助线与指针之间的夹角计算度数
电压表读数:
def reading_V(img):
    k1 = 0
    k2 = 0
    W = Image.open(img).width
    H = Image.open(img).height
    img = cv2.imread(img)
    kernel = np.ones((6, 6), np.float32) / 25
    gray_cut_filter2D = cv2.filter2D(img, -1, kernel)
    gray_img = cv2.cvtColor(gray_cut_filter2D, cv2.COLOR_BGR2GRAY)
    ret, thresh1 = cv2.threshold(gray_img, 180, 255, cv2.THRESH_BINARY)
    tm = thresh1.copy()
    test_main = tm[int(W / 25):int(W * 23 / 25), int(H / 25):int(H * 23 / 25)]
    edges = cv2.Canny(test_main, 50, 150, apertureSize=3)
    lines = cv2.HoughLines(edges, 1, np.pi / 180, 55)
    lines = lines[:, 0, :]
    result = edges.copy()
    for rho, theta in lines:
        a = np.cos(theta)
        b = np.sin(theta)
        x0 = a * rho
        y0 = b * rho
        x1 = int(x0 + result.shape[1] * (-b))
        y1 = int(y0 + result.shape[1] * a)
        x2 = int(x0 - result.shape[0] * (-b))
        y2 = int(y0 - result.shape[0] * a)
        # 零刻度线
        if y1 >= H / 20 and y1 < H * 1 / 3:
            k1 = line_k(x1, y1, x2, y2)
            cv2.line(img, (x1, y1), (x2, y2), (0, 255, 0), 2)
        # 指针
        if y2 >= H / 2 and y2 <= H * 4 / 5 and x2 >= H / 8:
            k2 = line_k(x1, y1, x2, y2)
            cv2.line(img, (x1, y1), (x2, y2), (0, 255, 0), 2)
    Cobb = int(math.fabs(np.arctan((k1 - k2) / (float(1 + k1 * k2))) * 180 / np.pi) + 0.5)
    print("度数为:", int(Cobb * 250 / 90))
    return int(Cobb * 250 / 90)
电流表读数:
def reading_A(img):
    k1 = 0
    k2 = 0
    W = Image.open(img).width
    H = Image.open(img).height
    img = cv2.imread(img)
    kernel = np.ones((6, 6), np.float32) / 25
    gray_cut_filter2D = cv2.filter2D(img, -1, kernel)
    gray_img = cv2.cvtColor(gray_cut_filter2D, cv2.COLOR_BGR2GRAY)
    ret, thresh1 = cv2.threshold(gray_img, 180, 255, cv2.THRESH_BINARY)
    tm = thresh1.copy()
    test_main = tm[int(W / 25):int(W * 23 / 25), int(H / 25):int(H * 23 / 25)]
    edges = cv2.Canny(test_main, 50, 150, apertureSize=3)
    lines = cv2.HoughLines(edges, 1, np.pi / 180, 50)
    lines = lines[:, 0, :]
    result = edges.copy()
    for rho, theta in lines:
        a = np.cos(theta)
        b = np.sin(theta)
        x0 = a * rho
        y0 = b * rho
        x1 = int(x0 + result.shape[1] * (-b))
        y1 = int(y0 + result.shape[1] * a)
        x2 = int(x0 - result.shape[0] * (-b))
        y2 = int(y0 - result.shape[0] * a)
        # 零刻度线
        if y1 >= H / 20 and y1 < H * 1 / 3:
            k1 = line_k(x1, y1, x2, y2)
            cv2.line(img, (x1, y1), (x2, y2), (0, 255, 0), 2)
        # 指针
        if y2 >= H / 2 and y2 <= H * 4 / 5 and x2 >= H / 8:
            k2 = line_k(x1, y1, x2, y2)
            cv2.line(img, (x1, y1), (x2, y2), (0, 255, 0), 2)
    Cobb = int(math.fabs(np.arctan((k1 - k2) / (float(1 + k1 * k2))) * 180 / np.pi) + 0.5)
    print("度数为:", int(Cobb * 40 / 90))
    return int(Cobb * 40 / 90)
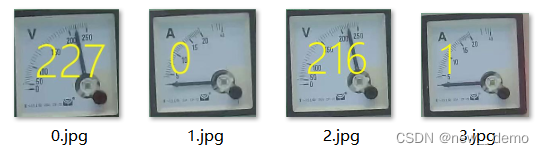
7. 保存结果
将结果保存在图片上:
def save_clock(img, read, path):
    # 设置字体,如果没有,也可以不设置
    font = ImageFont.truetype("C:\WINDOWS\FONTS\MSYHL.TTC", 50)
    # 打开底版图片
    tp = Image.open(img)
    # 在图片上添加文字 1
    draw = ImageDraw.Draw(tp)
    draw.text((50, 50), str(read), (255, 255, 0), font=font)
    # 保存
    tp.save(path)
由于裁剪框的位置不同,最终结果存在一定误差:
向http接口发送结果(也可以使用postman工具测试):
sendAns.py
def send(rack1_res):
    conn = http.client.HTTPConnection("192.168.0.103:5000")
    rack1_1 = rack1_res[0]
    rack1_2 = rack1_res[1]
    rack1_3 = rack1_res[2]
    rack1_4 = rack1_res[3]
    payload = "{\n    \"username\" : \"asd123\"," \
              "\n    \"password\" : \"123\"," \
              "\n    \"rack1_1\" : \"%s\" ," \
              "\n    \"rack1_2\" : \"%s\"," \
              "\n    \"rack1_3\" : \"%s\"," \
              "\n    \"rack1_4\" : \"%s\"" \
              "\n}" % (rack1_1, rack1_2, rack1_3, rack1_4)
    headers = {


        'content-type': "application/json",
        'cache-control': "no-cache",
        'postman-token': "a1fa6df2-a806-fdbd-6963-4342f9eb4227"
    }
    conn.request("POST", "/get", payload, headers)
    res = conn.getresponse()
    data = res.read()