在echarts中,想要实现动态的x轴,需要使用到定时器;那么想要实现动态的改变折线图面积如何实现呢,以下是图例demo效果:
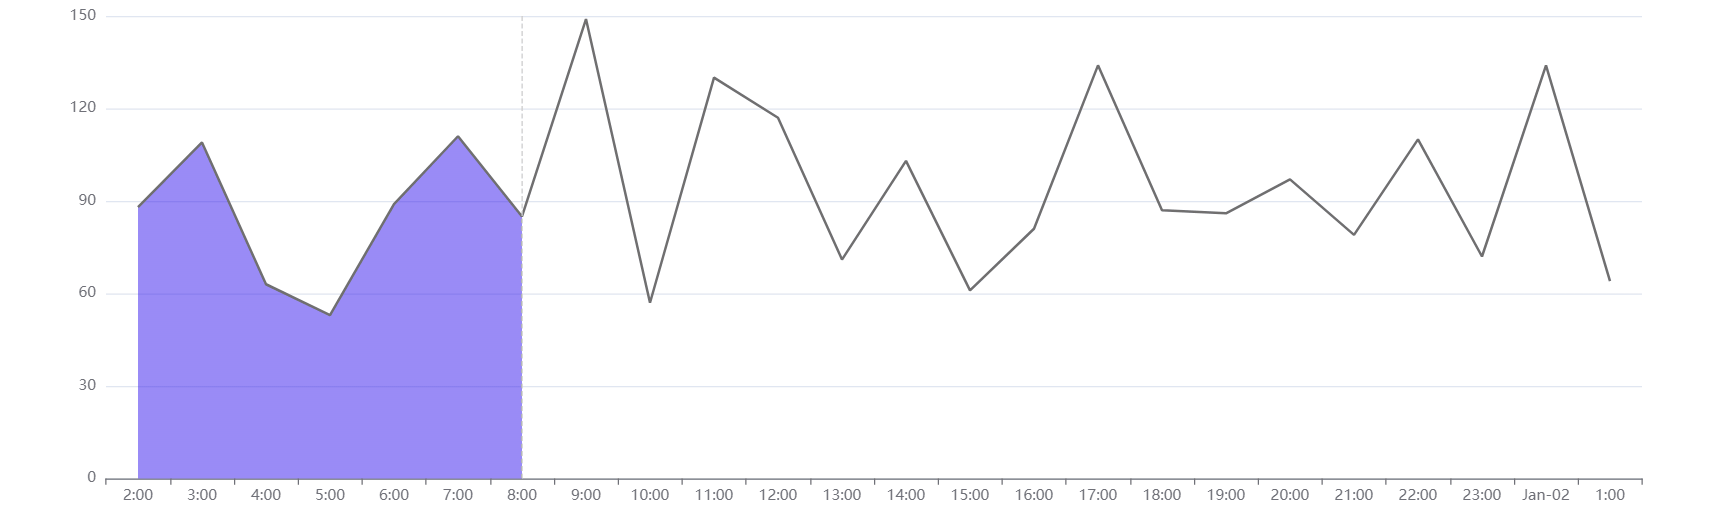
上一篇介绍了如何实现一条折线图显示不同的颜色,通过markLine图表标线搭配visualMap觉映射组件配合实现,这里的效果我们依旧用markLine搭配visualMap去实现。
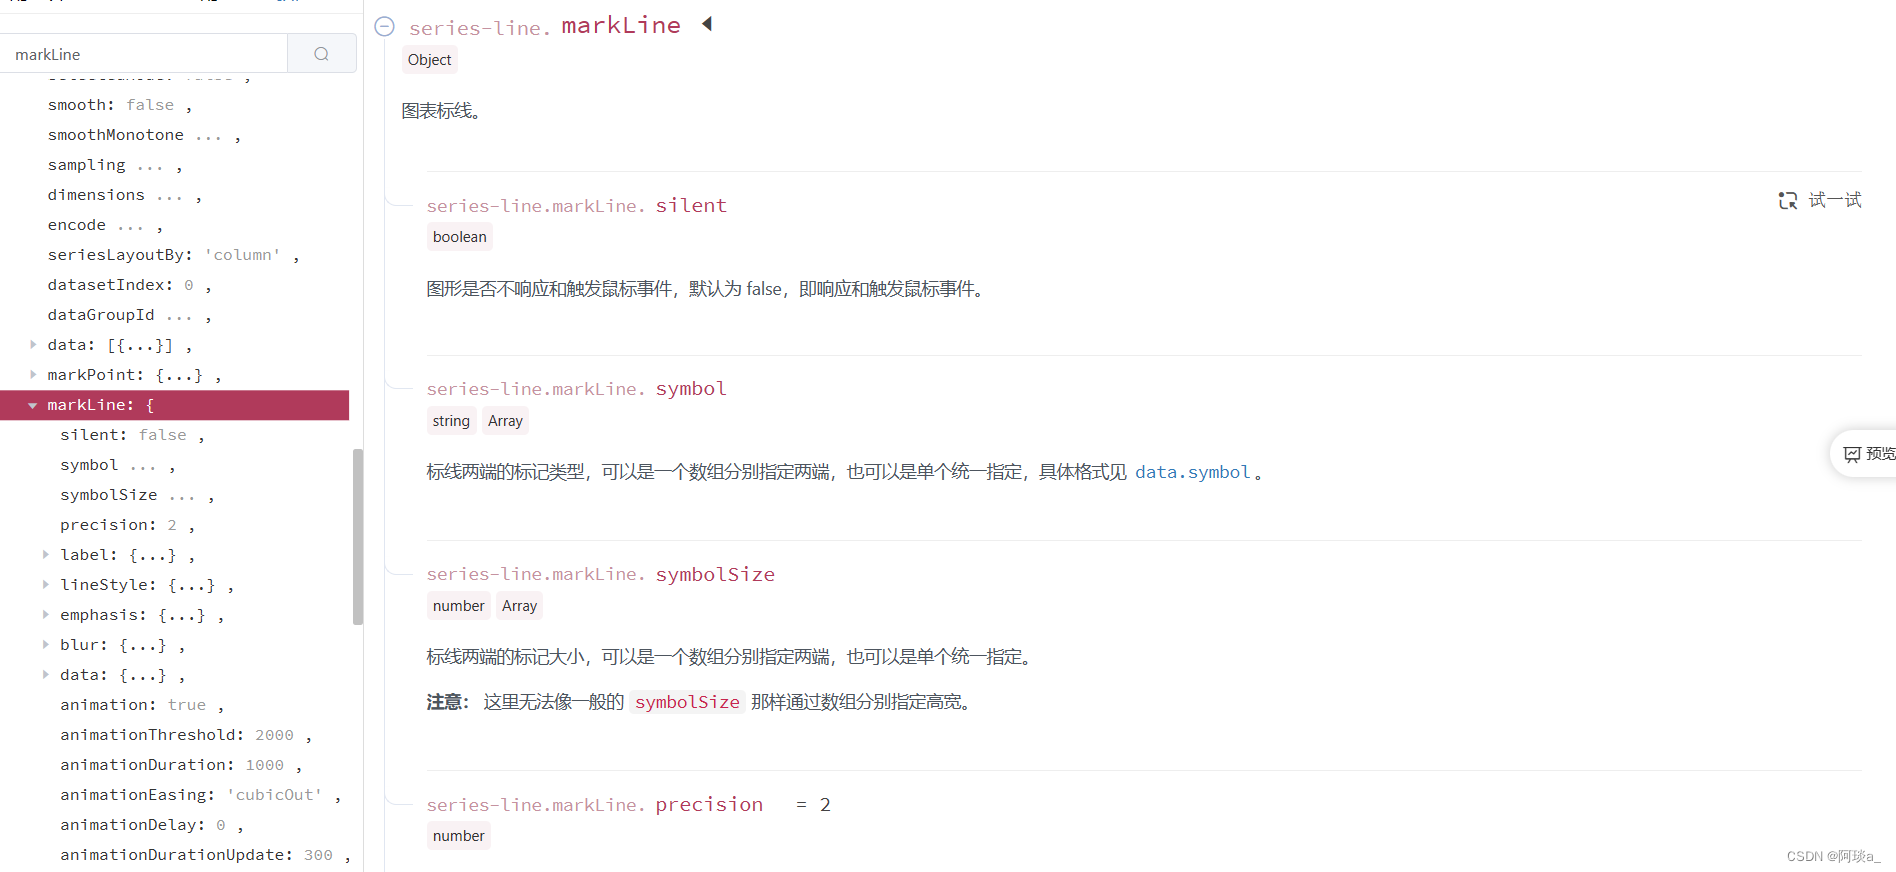
markLine图表标线,官方文档地址:Documentation - Apache ECharts
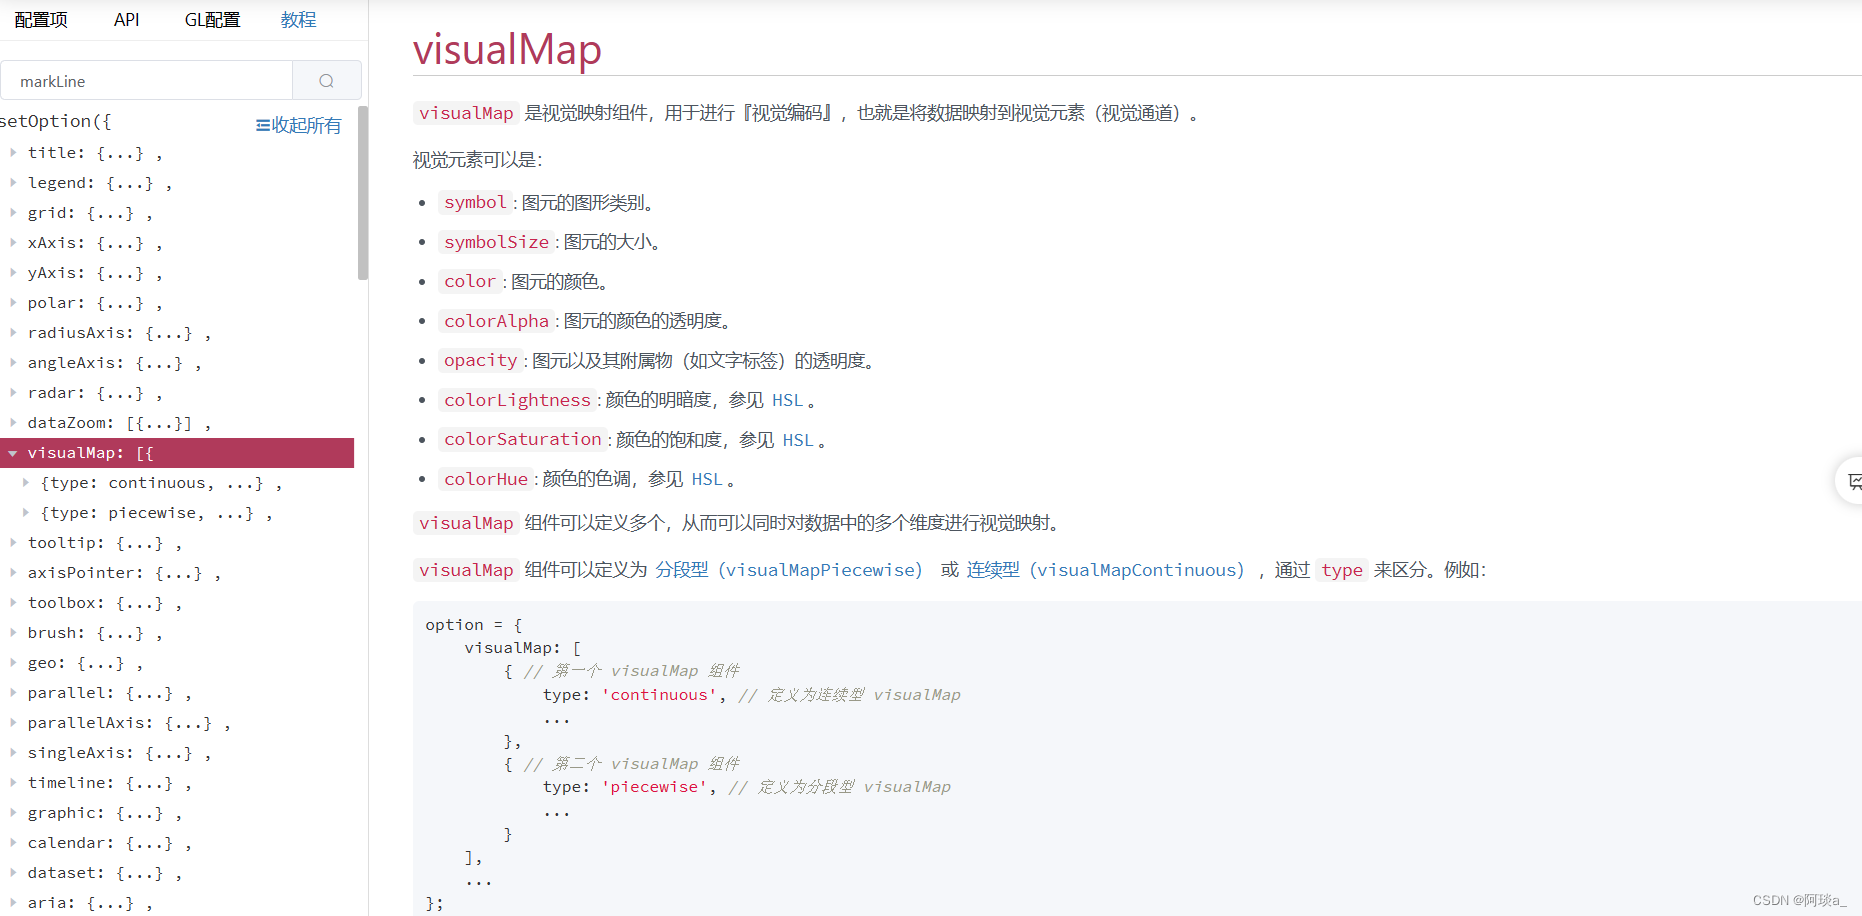
visualMap官方文档地址:Documentation - Apache ECharts
第一步,我们先实现静态的效果
const charts1 = useRef();
let time = [];
let data= [];
let now = new Date(2023, 0, 1);
let oneHours = 3600 * 1000;
let date=moment(now);

const option1 ={
        xAxis: {
            type: 'category',
            data: time,
            axisLabel: {
                formatter: function (value) {
                    if (moment(value).hours() == 0) {
                        const m = moment(value).toString().split(" ")[1];
                        const d = moment(value).toString().split(" ")[2];
                        return m + "-" + d;
                    } else {
                        return moment(value).format("H:mm");
                    }
                },
            },
        },
        yAxis: {
            type: 'value',
        },
        visualMap: {
            type: "piecewise",
            show: false,
            dimension: 0,
            seriesIndex: 0,
            pieces: [
                {
                    gt: 0,
                    lt: 6,
                    color: "rgba(41,11,236,0.68)",
                },
            ],
        },
        series: [
            {
                data: data,
                type: 'line',
                symbol: "none", //取消折线上的圆点
                lineStyle: {
                    color: "#706F6F",
                },
                areaStyle: {},//折线图填充为面积图
                markLine: {
                    silent: true,
                    symbol: ["none", "none"],
                    lineStyle: {
                        color: "#ccc",
                    },
                    animation: false, //关闭动画
                    label: {
                        show: false,
                    },
                    data: [
                        {
                            xAxis: 6,//在x轴第六格处建立一条图表标线
                        },
                    ],
                },
            },

        ]
    };
 for (var i = 0; i < 24; i++) {
        date+=oneHours
        time.push(moment(date).format('YYYY-MM-DD HH:mm'));
        data.push((Math.random() * 100+50).toFixed())
    }
 useEffect(()=>{
        const chart1=echarts.init(charts1.current);
        chart1.setOption(option2,true)
    },[])

 return (
        <div style={

   {width:'100%',height:500}}>
             <div ref={charts1} style={

   {width:'100%',height:'100%'}}></div>
        </div>

    );
以上代码就可以实现静态的效果,想要让图表动起来,我们需要再去写一个定时器。
useEffect(()=>{
        const timer = setInterval(()=>{
            date+=oneHours

            time.shift();
            time.push(moment(date).format('YYYY-MM-DD HH:mm'));

            data.shift();
            data.push((Math.random() * 100+50).toFixed());

            const chart1=echarts.init(charts1.current)
            chart1.setOption({
                xAxis:{
                    data:time
                },
                series:[
                    {
                        data: data,
                    }
                ]
            })
        },2000)
        return()=>{
            clearTimeout(timer)
        }
    },[])
设置两秒间隔,每次删除头部的一个数据,在尾部再插入一个数据,然后setOption更新echarts图表,就能实现图例demo中的效果了。
如果这篇文章对你有用,请帮忙点个小赞支持一下,也欢迎留言探讨。