原始数据承接免疫浸润分析(1),下面展示免疫浸润结果:
#直接使用IOBR包内的cell_bar_plot
pic<-cell_bar_plot(input = quantiseq_immo_de[1:20,], title = "quanTiseq Cell Fraction")
#使用ggplot2
library(ggplot2)
library(magrittr)
data_gg<-pic$data
pic1<-data_gg %>%
  ggplot(aes(ID,fraction))+
  theme_void()+
  geom_bar(stat = "identity",position = "stack",aes(fill=cell_type))+
  scale_fill_manual(values = palette2,name=NULL)+
  theme(axis.text.x = element_text(angle = 90),
        axis.ticks.x = element_blank(),
        axis.text.y= element_text(),
        legend.position = "right"
) 
#箱线图
library(forcats)
#fct_reorder(cell_type, fraction): 将cell_type变量重新排序,排序的顺序与fraction变量的值相关。这样可以根据fraction的大小对cell_type进行重新排序,将出现频率较高的cell_type放在前面
pic2 <- ggplot(data_gg,aes(fct_reorder(cell_type, fraction),fraction,fill = cell_type)) +
  geom_boxplot() +
  geom_jitter(width = 0.3,aes(color=cell_type))+
  theme_bw() +
  labs(x = "Cell Type", y = "Estimated Proportion by quanTIseq") +
  theme(axis.text.x = element_text(angle = 90,hjust=1),
        axis.ticks.x = element_blank(),
        legend.position = "right") +
  scale_fill_manual(values = palette1)
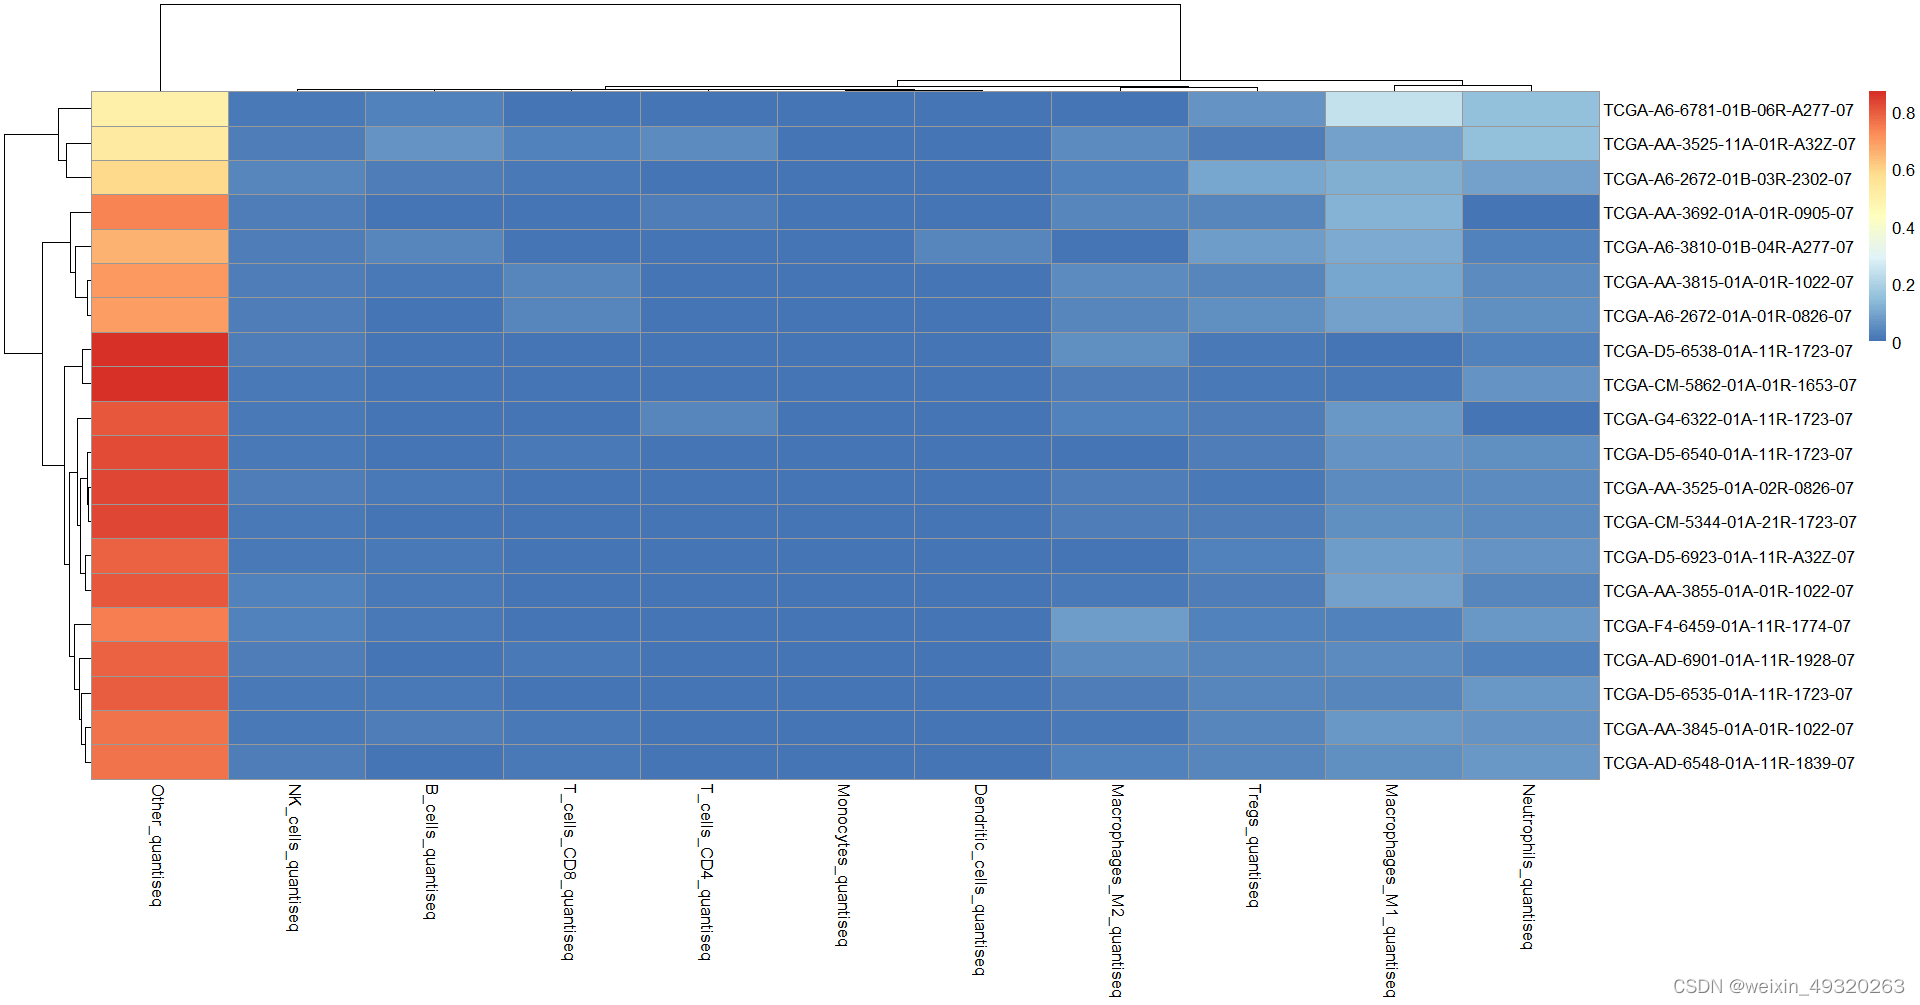
#热图
library(pheatmap)
heatdata<-quantiseq_immo_de[,-1]
rownames(heatdata)<-quantiseq_immo_de$ID
args(heatmap)
pheatmap(heatdata[1:20,])