怎么在同一页面内画多张图?主要用到的是matplotlib库中的subplot函数
附代码:
import seaborn
import numpy
import matplotlib.pyplot as plt
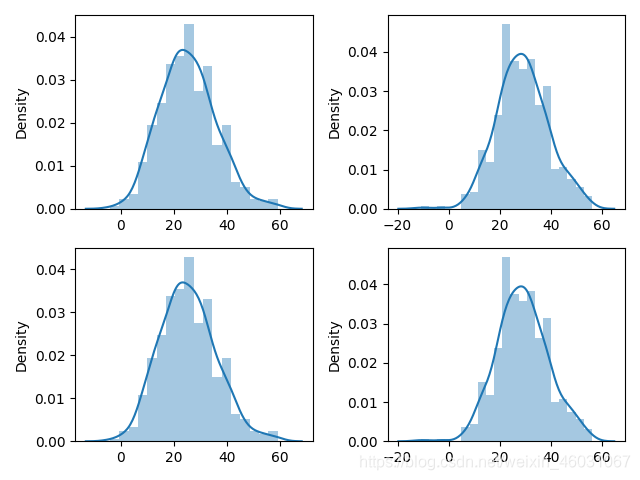
dist_data_1=numpy.random.normal(25,10,500).astype(int)
dist_data_2=numpy.random.normal(30,10,500).astype(int)
fig,axes=plt.subplots(2,2)
#生成2*2的画布
plt.subplot(2,2,1)
#画布中的第一张图
seaborn.distplot(dist_data_1,ax=axes[0][0])
plt.subplot(2,2,2)
seaborn.distplot(dist_data_2,ax=axes[0][1])
plt.subplot(2,2,3)
seaborn.distplot(dist_data_1,ax=axes[1][0])
plt.subplot(2,2,4)
seaborn.distplot(dist_data_2,ax=axes[1][1])
plt.show()
最终得到的结果如图:
如果要画1*2的两个图,将axes[][]改成axes[]