import matplotlib.pyplot as plt
import numpy as np
def test4():
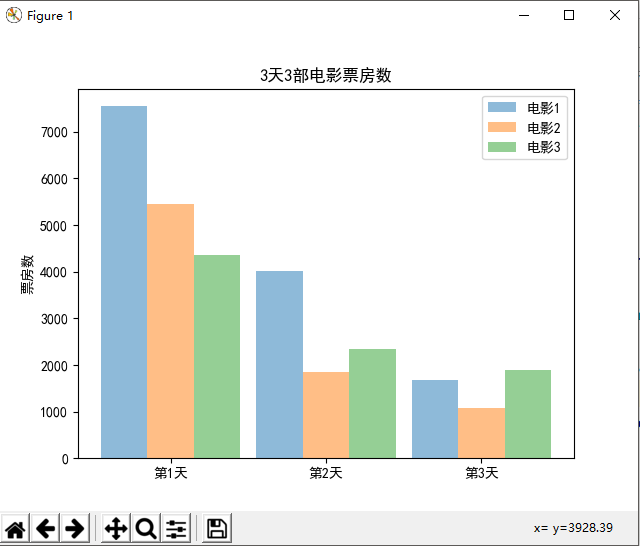
names = ['电影1', '电影2', '电影3']
real_num1 = [7548, 4013, 1673]
real_num2 = [5453, 1840, 1080]
real_num3 = [4348, 2345, 1890]
x = np.arange(len(names))
# 绘制柱形图
width = 0.3
plt.bar(x, real_num1, alpha=0.5, width=width, label=names[0])
plt.bar([i+width for i in x], real_num2, alpha=0.5, width=width, label=names[1])
plt.bar([i+2*width for i in x], real_num3, alpha=0.5, width=width, label=names[2])
# 正常显示中文
plt.rcParams["font.sans-serif"] = ["SimHei"]
# 设置x坐标轴的值
x_label = ["第{}天".format(i+1) for i in x]
# 让x坐标轴显示在中间
plt.xticks([i+width for i in x], x_label)
# 添加ylabel
plt.ylabel("票房数")
# 添加图例
plt.legend()
# 添加标题
plt.title("3天3部电影票房数")
plt.show()
test4()
结果显示: