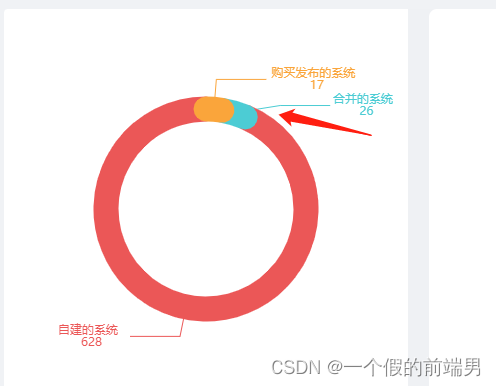
逻辑 : 根据饼图 改变 radius为["50%", "50%"] 通过itemStyle下的normal 的字段 调整borderWidth borderColor 即可 shadowColor
<template>
	<div class="box1">
		<div ref="echartsRef" class="pie-box"></div>
	</div>
</template>

<script setup lang="ts" name="pieChart">
import {

       ref, onMounted } from "vue";
import * as echarts from "echarts";
import {

       ElMessage } from "element-plus";
import {

       useEcharts } from "@/hooks/useEcharts";
import {

       sysClass } from "@/api/modules/system";
const echartsRef = ref<HTMLElement>();

// 定义饼图data类型

const getEarning = async () => {


	try {


		const res = await sysClass();
		if (res.success) {


			console.log(res, "我是系统类比");
			let data = [] as any[];
			res?.data.map((item: any) => {


				if (item.source != -2 && item.source != 2) {


					let obj = {


						name: filter(item.source),
						value: item.COUNT
					};

					data.push(obj);
				}
			});
			initEchart(data);
		} else {


			ElMessage.error(res.msg);
		}
	} catch (err: any) {


		ElMessage.error(err);
	}
};
const filter = (data: any) => {


	if (data == -1) {


		return "购买发布的系统";
	}
	if (data == -2) {


		return " 试用发布的系统";
	}
	if (data == 2) {


		return "复制的系统";
	}
	if (data == 1) {


		return "合并的系统";
	}
	if (data == 0) {


		return "自建的系统";
	}
};

const initEchart = (data1: any) => {


	let color = ["#EB5757", "#4CCCD4", "#FAA53B"];
	let data = [];
	for (let i = 0; i < data1.length; i++) {


		data.push({


			value: data1[i].value,
			name: data1[i].name,
			itemStyle: {


				normal: {


					borderWidth: 25,
					// shadowBlur: 5,
					borderColor: color[i],
					shadowColor: color[i]
				}
			}
		});
	}
	console.log(data, "的值");
	let myChart: echarts.ECharts = echarts.init(echartsRef.value as HTMLElement);
	let seriesOption = [
		{


			name: "",
			type: "pie",
			clockWise: false,
			radius: ["50%", "50%"],
			hoverAnimation: false,
			itemStyle: {


				normal: {


					label: {


						show: true,
						position: "outside",
						overflow: "none",
						color: "inherit",
						align: "center",
						rich: {


							a1: {


								align: "center"
							}
						},
						formatter: function (params) {


							console.log(params, "每一个的值");
							return `{a1|${
        params.name}}  \n` + `{a1|${
        params.value}}`;
						}
					},
					labelLine: {


						length: 30,
						length2: 50,
						// maxSurfaceAngle: 90,
						show: true,
						color: "#00ffff"
					}
				}
			},
			data: data
		}
	];
	let option: echarts.EChartsOption = {


		backgroundColor: "white",
		color: color,
		title: {


			top: "48%",
			left: "49%",
			textAlign: "center"
		},
		tooltip: {


			show: false
		},
		toolbox: {


			show: false
		},
		series: seriesOption
	};
	useEcharts(myChart, option);
};
onMounted(() => {


	getEarning();
});
</script>

<style scoped lang="scss">
.box1 {


	width: 100%;
	height: 100%;
	.pie-box {


		width: 100%;
		height: 100%;
	}
}
</style>