先看下效果图,并且数据每隔5秒自动变换一次
先看下后台返回的数据结构是什么样子的
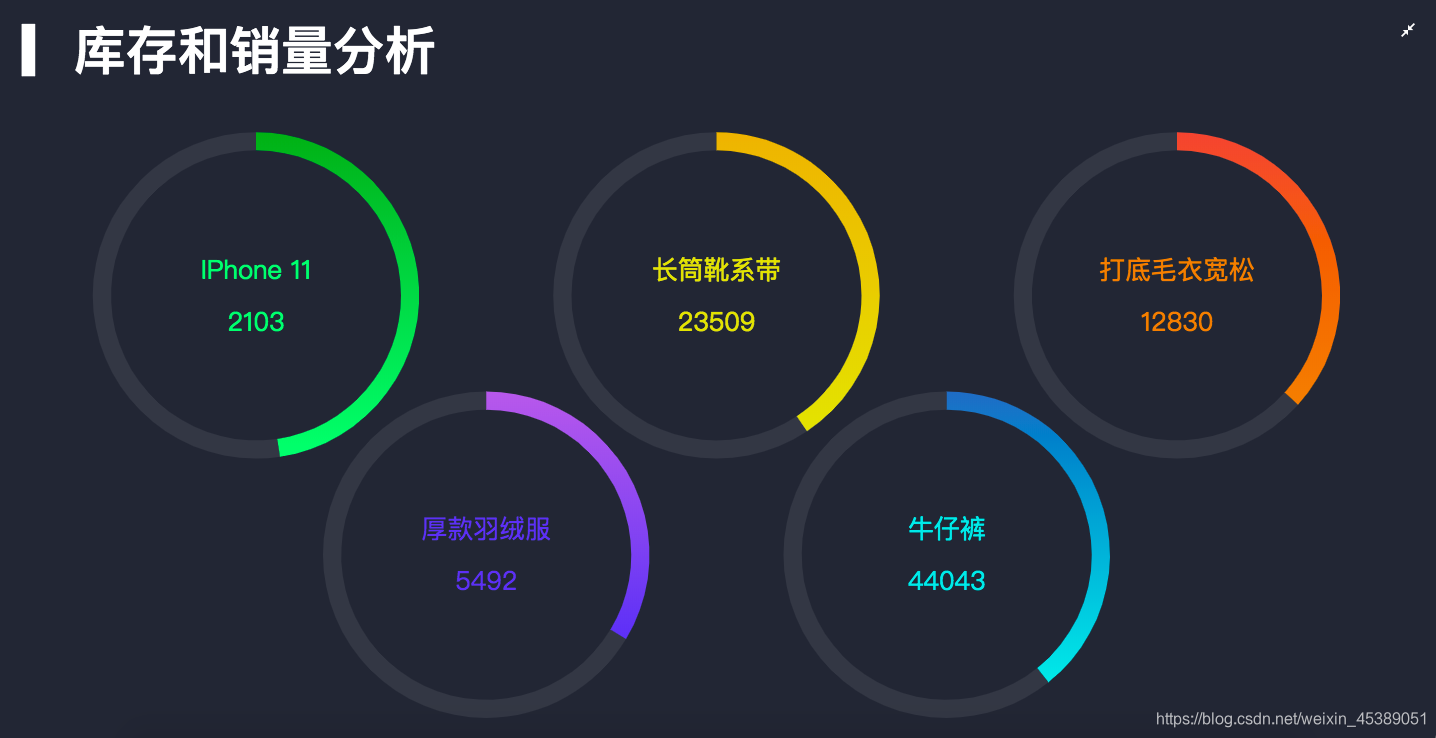
[{
    "name": "IPhone 11",
    "stock": 2310,
    "sales": 2103
}, {
    "name": "长筒靴系带",
    "stock": 34312,
    "sales": 23509
}, {
    "name": "打底毛衣宽松",
    "stock": 22140,
    "sales": 12830
}, {
    "name": "厚款羽绒服",
    "stock": 10842,
    "sales": 5492
}, {
    "name": "牛仔裤",
    "stock": 68102,
    "sales": 44043
}, {
    "name": "加厚卫衣",
    "stock": 12032,
    "sales": 8603
}, {
    "name": "衬衫",
    "stock": 9890,
    "sales": 8960
}, {
    "name": "HUAWEI P30",
    "stock": 20130,
    "sales": 12302
}, {
    "name": "手机壳",
    "stock": 89342,
    "sales": 42948
}, {
    "name": "打底裤",
    "stock": 5034,
    "sales": 1220
}]
好了,开始实现前端的代码
html
<div class="com-page">
<div class="com-container">
<div class="com-chart" ref="stock_ref"></div>
</div>
</div>
css
html,body,#app{
  width: 100%;
  height: 100%;
  padding: 0;
  margin: 0;
  overflow: hidden;
}
.com-page {
  width: 100%;
  height: 100%;
  overflow: hidden;
}

.com-container {
  position: relative;
  width: 100%;
  height: 100%;
  overflow: hidden;
}

.com-chart {
  width: 100%;
  height: 100%;
  overflow: hidden;
}
data
data() {
return {
chartInstance: null, //初始化echartInstance对象
allData: null, //接收的后台数据
currentIndex: 0, // 当前显示的数据
timerId: null, // 定时器的标识
};
},
methods
initChart方法
initChart() {
     //初始化echartInstance对象
     //chalk是我们定义的主题,echarts官方有案例,怎么使用可以百度一下,不喜欢可以直接删掉
  this.chartInstance = this.$echarts.init(this.$refs.stock_ref, "chalk");
  const initOption = {
    title: {
      text: "▎库存和销量分析",
      left: 20,
      top: 20,
    },
  };
  this.chartInstance.setOption(initOption);
   //对图表对象进行鼠标事件监听
   //鼠标移入,定时器停止
  this.chartInstance.on('mouseover', () => {
    clearInterval(this.timerId)
  })
   //鼠标移出,定时器开始
  this.chartInstance.on('mouseout', () => {
    this.startInterval()
  })
},
getData方法
扫描二维码关注公众号,回复:
12443341 查看本文章

这里还是用http请求获取的数据,后面我再讲怎么用WebSocket获取我们的数据
 async getData() {
      // 获取服务器的数据, 对this.allData进行赋值之后, 调用updateChart方法更新图表
      const { data: ret } = await this.$http.get("stock");
      this.allData = ret;
      console.log(this.allData);
      this.updateChart();
      this.startInterval();
    },
screenAdapter方法
//适配屏幕
 screenAdapter() {
      const titleFontSize = (this.$refs.stock_ref.offsetWidth / 100) * 3.6;
      const innerRadius = titleFontSize * 2.8;
      const outterRadius = innerRadius * 1.125;
      const adapterOption = {
        title: {
          textStyle: {
            fontSize: titleFontSize,
          },
        },
        series: [
          {
            type: "pie",
            radius: [outterRadius, innerRadius],
            label: {
              fontSize: titleFontSize / 2,
            },
          },
          {
            type: "pie",
            radius: [outterRadius, innerRadius],
            label: {
              fontSize: titleFontSize / 2,
            },
          },
          {
            type: "pie",
            radius: [outterRadius, innerRadius],
            label: {
              fontSize: titleFontSize / 2,
            },
          },
          {
            type: "pie",
            radius: [outterRadius, innerRadius],
            label: {
              fontSize: titleFontSize / 2,
            },
          },
          {
            type: "pie",
            radius: [outterRadius, innerRadius],
            label: {
              fontSize: titleFontSize / 2,
            },
          },
        ],
      };
      this.chartInstance.setOption(adapterOption);
      this.chartInstance.resize();
    },
updateChart方法
//更新视图
 updateChart() {
      //中心点坐标
      const centerArr = [
        ["18%", "40%"],
        ["50%", "40%"],
        ["82%", "40%"],
        ["34%", "75%"],
        ["66%", "75%"],
      ];
      const colorArr = [
        ["#4FF778", "#0BA82C"],
        ["#E5DD45", "#E8B11C"],
        ["#E8821C", "#E55445"],
        ["#5052EE", "#AB6EE5"],
        ["#23E5E5", "#2E72BF"],
      ];
      const start = this.currentIndex * 5;
      const end = (this.currentIndex + 1) * 5;
      const showData = this.allData.slice(start, end);
      const seriesArr = showData.map((item, index) => {
        return {
          type: "pie",
          center: centerArr[index],
          hoverAnimation: false, // 关闭鼠标移入到饼图时的动画效果
          labelLine: {
            show: false, // 隐藏指示线
          },
          label: {
            position: "center",
            color: colorArr[index][0],
          },
          data: [
            //销量
            {
              value: item.sales,
              name: item.name + "\n\n" + item.sales,
              itemStyle: {
                color: new this.$echarts.graphic.LinearGradient(0, 1, 0, 0, [
                  {
                    offset: 0,
                    color: colorArr[index][0],
                  },
                  {
                    offset: 1,
                    color: colorArr[index][1],
                  },
                ]),
              },
            },
            //库存
            {
              value: item.stock,
              itemStyle: {
                color: "#333843",
              },
            },
          ],
        };
      });
      const dataOption = {
        series: seriesArr,
      };
      this.chartInstance.setOption(dataOption);
    },
startInterval方法
//定时器
startInterval() {
      if (this.timerId) {
        clearInterval(this.timerId);
      }
      this.timerId = setInterval(() => {
        this.currentIndex++;
        if (this.currentIndex > 1) {
          this.currentIndex = 0;
        }
        this.updateChart(); // 在更改完currentIndex之后 , 需要更新界面
      }, 5000);
    },
mounted
  mounted() {
    this.initChart()
    this.getData()
    window.addEventListener('resize', this.screenAdapter)
    this.screenAdapter()
  },
destroyed
  destroyed() {
    clearInterval(this.timerId)
    window.removeEventListener('resize', this.screenAdapter)
  },
好了,完事,下面我把如何用WebSocket获取数据说一下
封装了一个WebSocket
export default class SocketService {
  /**
   * 单例
   */
  static instance = null
  static get Instance() {
    if (!this.instance) {
      this.instance = new SocketService()
    }
    return this.instance
  }

  // 和服务端连接的socket对象
  ws = null

  // 存储回调函数
  callBackMapping = {}

  // 标识是否连接成功
  connected = false

  // 记录重试的次数
  sendRetryCount = 0

  // 重新连接尝试的次数
  connectRetryCount = 0

  //  定义连接服务器的方法
  connect() {
    // 连接服务器
    if (!window.WebSocket) {
      return console.log('您的浏览器不支持WebSocket')
    }
    this.ws = new WebSocket('ws://localhost:9998')

    // 连接成功的事件
    this.ws.onopen = () => {
      console.log('连接服务端成功了')
      this.connected = true
      // 重置重新连接的次数
      this.connectRetryCount = 0
    }
    // 1.连接服务端失败
    // 2.当连接成功之后, 服务器关闭的情况
    this.ws.onclose = () => {
      console.log('连接服务端失败')
      this.connected = false
      this.connectRetryCount++
      setTimeout(() => {
        this.connect()
      }, 500 * this.connectRetryCount)
    }
    // 得到服务端发送过来的数据
    this.ws.onmessage = msg => {
      console.log('从服务端获取到了数据')
      // 真正服务端发送过来的原始数据时在msg中的data字段
      // console.log(msg.data)
      const recvData = JSON.parse(msg.data)
      const socketType = recvData.socketType
      // 判断回调函数是否存在
      if (this.callBackMapping[socketType]) {
        const action = recvData.action
        if (action === 'getData') {
          const realData = JSON.parse(recvData.data)
          this.callBackMapping[socketType].call(this, realData)
        } else if (action === 'fullScreen') {
          this.callBackMapping[socketType].call(this, recvData)
        } else if (action === 'themeChange') {
          this.callBackMapping[socketType].call(this, recvData)
        }
      }
    }
  }

  // 回调函数的注册
  registerCallBack (socketType, callBack) {
    this.callBackMapping[socketType] = callBack
  }

  // 取消某一个回调函数
  unRegisterCallBack (socketType) {
    this.callBackMapping[socketType] = null
  }

  // 发送数据的方法
  send (data) {
    // 判断此时此刻有没有连接成功
    if (this.connected) {
      this.sendRetryCount = 0
      this.ws.send(JSON.stringify(data))
    } else {
      this.sendRetryCount++
      setTimeout(() => {
        this.send(data)
      }, this.sendRetryCount * 500)
    }
  }
}
在main.js中进行连接,挂载原型
//对服务端进行连接
import SocketService from '../utils/socket_service'
SocketService.Instance.connect()
// 其他的组件  this.$socket
Vue.prototype.$socket = SocketService.Instance
然后在组件中
  created() {
    //在组件创建完成之后进行回调函数注册
    this.$socket.registerCallBack('trendData',this.getData)
  },

   mounted() {
    this.initChart();
    //发送数据给服务器,告诉服务器,我现在需要数据
    this.$socket.send({
      action:'getData',
      socketType:'trendData',
      chartName:'trend',
      value:''
    })
    window.addEventListener("resize", this.screenAdapter);
    this.screenAdapter();
  },

  destroyed() {
    window.removeEventListener("resize", this.screenAdapter);
    //取消
    this.$socket.unRegisterCallBack('trendData')
  },
  methods:{
  //res就是服务端发送给客户端的图表数据
    getData(res) {
      this.allData = res;
      this.updateChart();
    },
    }
这样就实现了后端发生变化,前端即时更新视图
至于为什么WebSocket这样封装,因为后台定了规则
const path = require('path')
const fileUtils = require('../utils/file_utils')
const WebSocket = require('ws')
// 创建WebSocket服务端的对象, 绑定的端口号是9998
const wss = new WebSocket.Server({
  port: 9998
})
// 服务端开启了监听
module.exports.listen = () => {
  // 对客户端的连接事件进行监听
  // client:代表的是客户端的连接socket对象
  wss.on('connection', client => {
    console.log('有客户端连接成功了...')
    // 对客户端的连接对象进行message事件的监听
    // msg: 由客户端发给服务端的数据
    client.on('message',async msg => {
      console.log('客户端发送数据给服务端了: ' + msg)
      let payload = JSON.parse(msg)
      const action = payload.action
      if (action === 'getData') {
        let filePath = '../data/' + payload.chartName + '.json'
        // payload.chartName // trend seller map rank hot stock
        filePath = path.join(__dirname, filePath)
        const ret = await fileUtils.getFileJsonData(filePath)
        // 需要在服务端获取到数据的基础之上, 增加一个data的字段
        // data所对应的值,就是某个json文件的内容
        payload.data = ret
        client.send(JSON.stringify(payload))
      } else {
        // 原封不动的将所接收到的数据转发给每一个处于连接状态的客户端
        // wss.clients // 所有客户端的连接
        wss.clients.forEach(client => {
          client.send(msg)
        })
      }
      // 由服务端往客户端发送数据
      // client.send('hello socket from backend')
    })
  })
}
有不懂的可以去我的github查看源代码,前后端都有,后端必须启动,前端才有显示,WebSocket我只配了Trend组件,其他全部一样的操作
github项目地址https://github.com/lsh555/Echarts
项目详情如下
