最近收到一个需求,要对 5000+的点位进行展示。直接展示的话满屏幕都是点,效果太丑,于是想到了聚合,聚合有很多种方案。首先你可以手动的些代码来计算某个范围内的点的数量然后再把聚合的结果展示在这个范围的某个位置。这针对于简单的需求是比较有效的。
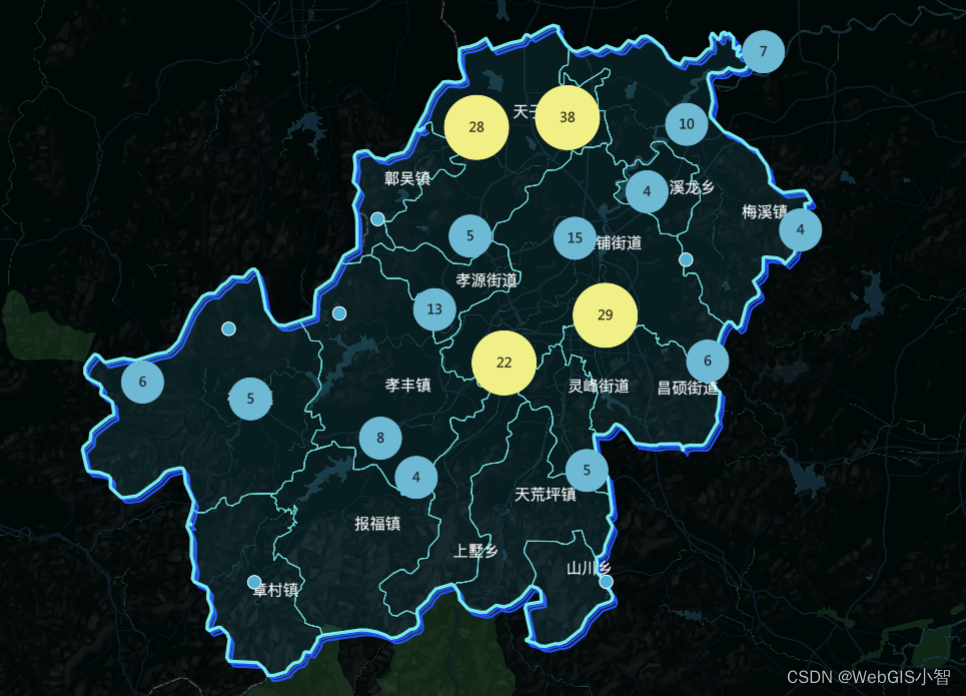
但是架不住有的时候客户很刁钻啊。他想要的效果是。聚合之后的点的位置还必须在点位比较密集的区域,那这样的话我们就得使用 mapbox 自带的聚合功能了。我们直接把图层的 cluster 设置开启,mapbox 会帮助我们自动计算聚合的结果。当然什么条件下聚合需要你指定。聚合多大范围也需要你指定。
首先你必须准备一批 点位的geojson 数据。然后可以通过下面的方式加载这批点位数据:
 map.addSource("earthquakes", {
        type: "geojson",
        data: point,
        cluster: true,
        clusterMaxZoom: 10, // Max zoom to cluster points on
        clusterRadius: 50, // Radius of each cluster when clustering points (defaults to 50)
      });

      map.addLayer({
        id: "clusters",
        type: "circle",
        source: "earthquakes",
        filter: ["has", "point_count"],
        paint: {
          "circle-color": [
            "step",
            ["get", "point_count"],
            "#51bbd6",
            20,
            "#f1f075",
            50,
            "#f28cb1",
          ],
          "circle-radius": ["step", ["get", "point_count"], 20, 20, 30, 50, 40],
        },
      });

      map.addLayer({
        id: "cluster-count",
        type: "symbol",
        source: "earthquakes",
        filter: ["has", "point_count"],
        layout: {
          "text-field": ["get", "point_count_abbreviated"],
          "text-font": ["literal", ["MicrosoftYaHei"]],
          "text-size": 12,
        },
      });

      map.addLayer({
        id: "unclustered-point",
        type: "circle",
        source: "earthquakes",
        filter: ["!", ["has", "point_count"]],
        paint: {
          "circle-color": "#11b4da",
          "circle-radius": 6,
          "circle-stroke-width": 1,
          "circle-stroke-color": "#fff",
        },
      });
来跟大家解释一下这段代码的意义。
第一步还是老样子加载好 source,需要注意的是必须写上 cluster:true以开启聚合效果。然后指定聚合最大层级clusterMaxZoom,这表示当超过这个最大层级之后。就不会有聚合效果了。
第三个参数是聚合半径clusterRadius,这个半径越大会检索到越广的范围进行聚合。
然后就是添加 layer 了。注意聚合之后的点位必须用 circle 类型的图层来表示,使用其他的图层是不行的。然后文字图层什么的大家伙就看着自己加吧。非聚合图层可以用其他的类型来表示比如说 symbol。
 map.map.loadImage("./icons/point.png", (error, image) => {
        if (error) throw error;
        map.map.addImage("cat", image);
        map.addLayer({
          id: "unclustered-point",
          type: "symbol",
          source: "earthquakes",
          filter: ["!", ["has", "point_count"]],
          layout: {
            "icon-image": "cat", // reference the image
            "icon-size": 0.55,
          },
        });
还有一个需要注意的点就是point_count这个参数不是数据中有的。这一点千万要记得。这个数据是 mapbox 框架为我们算出来的。你直接不用改直接用就好。point_count_abbreviated也是如此。