热力图在 maobox 中属于专题图的一种,他通过点的颜色和权重 来渲染点和点周围的指标情况。本文来跟大家分享一下如何使用 maobox 实现热力图的功能。
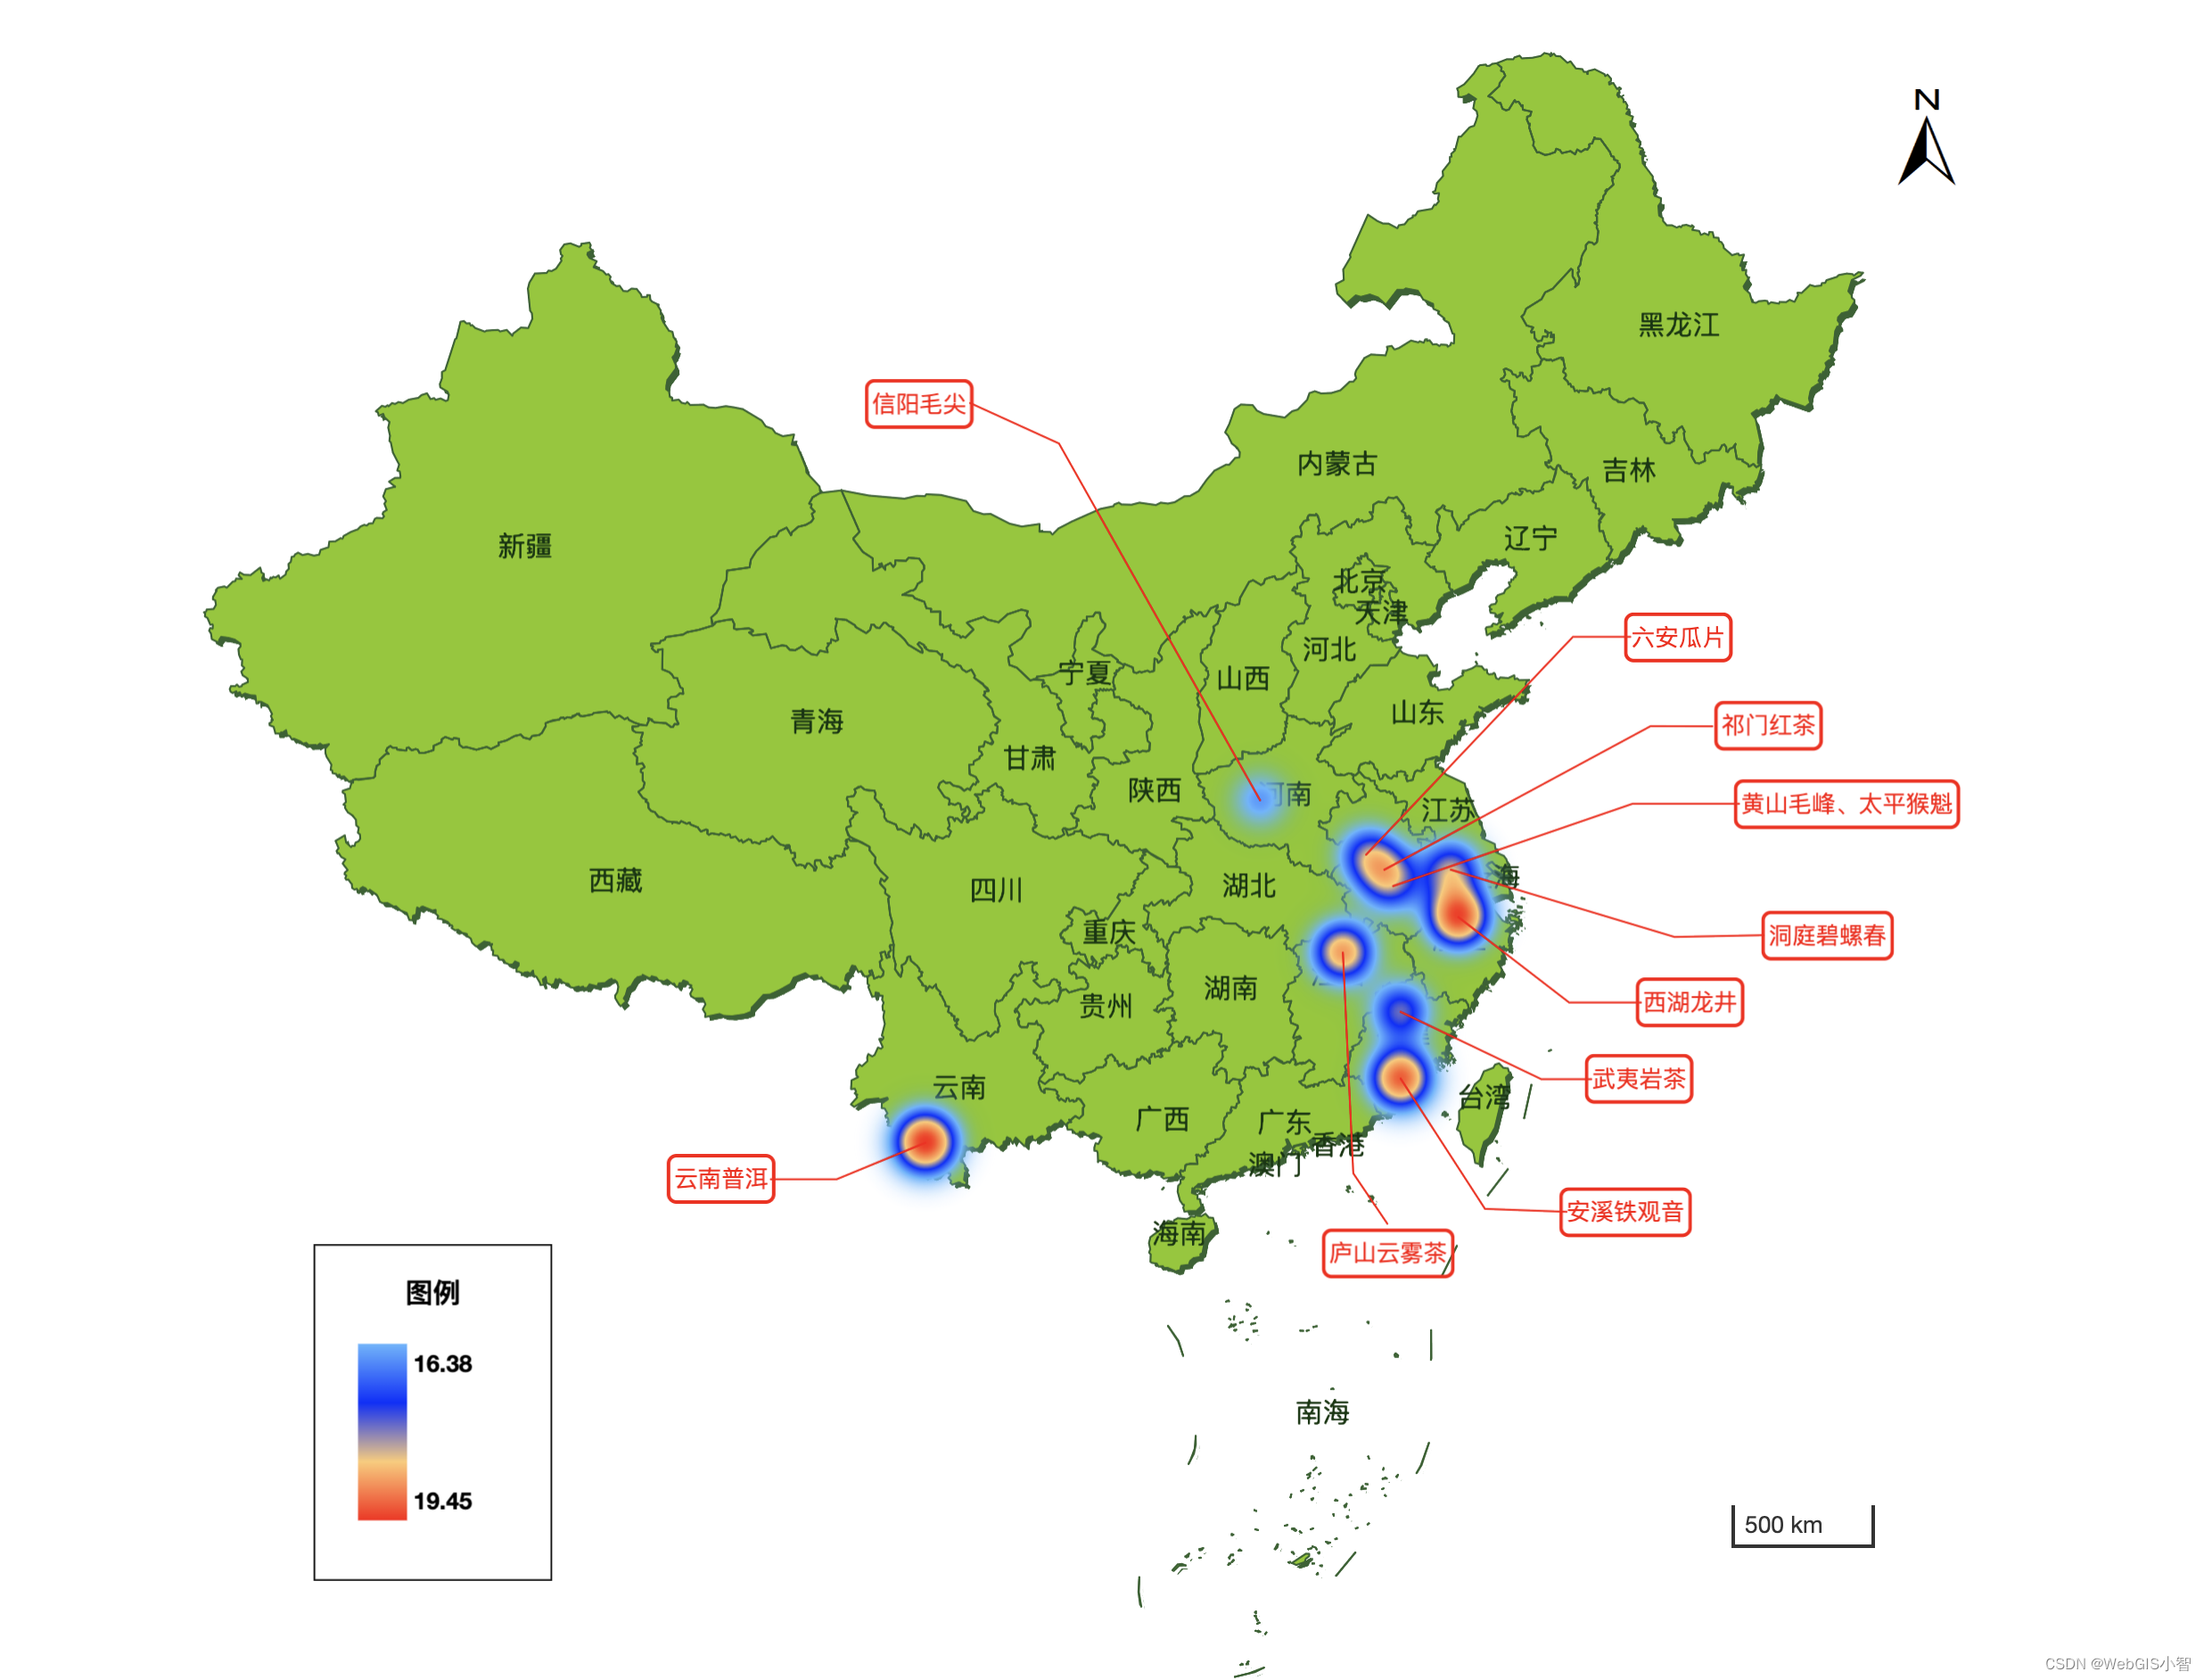
我们以全国十大名茶产区的温度指标为例,来做一个像上图这样的效果,
首先要有相关的点数据:
var tentea = {
  type: "FeatureCollection",
  features: [
    {
      type: "Feature",
      properties: {
        name: "西湖龙井",
        dis: "杭州市西湖区",
        temp: 19.21,
        rank: 2,
      },
      geometry: {
        type: "Point",
        coordinates: [120.07637104262216, 30.110987373108287],
      },
    },
    {
      type: "Feature",
      properties: {
        name: "安溪铁观音",
        dis: "泉州市安溪县",
        temp: 19.03,
        rank: 3,
      },
      geometry: {
        type: "Point",
        coordinates: [117.93324898736677, 24.798769462568657],
      },
    }