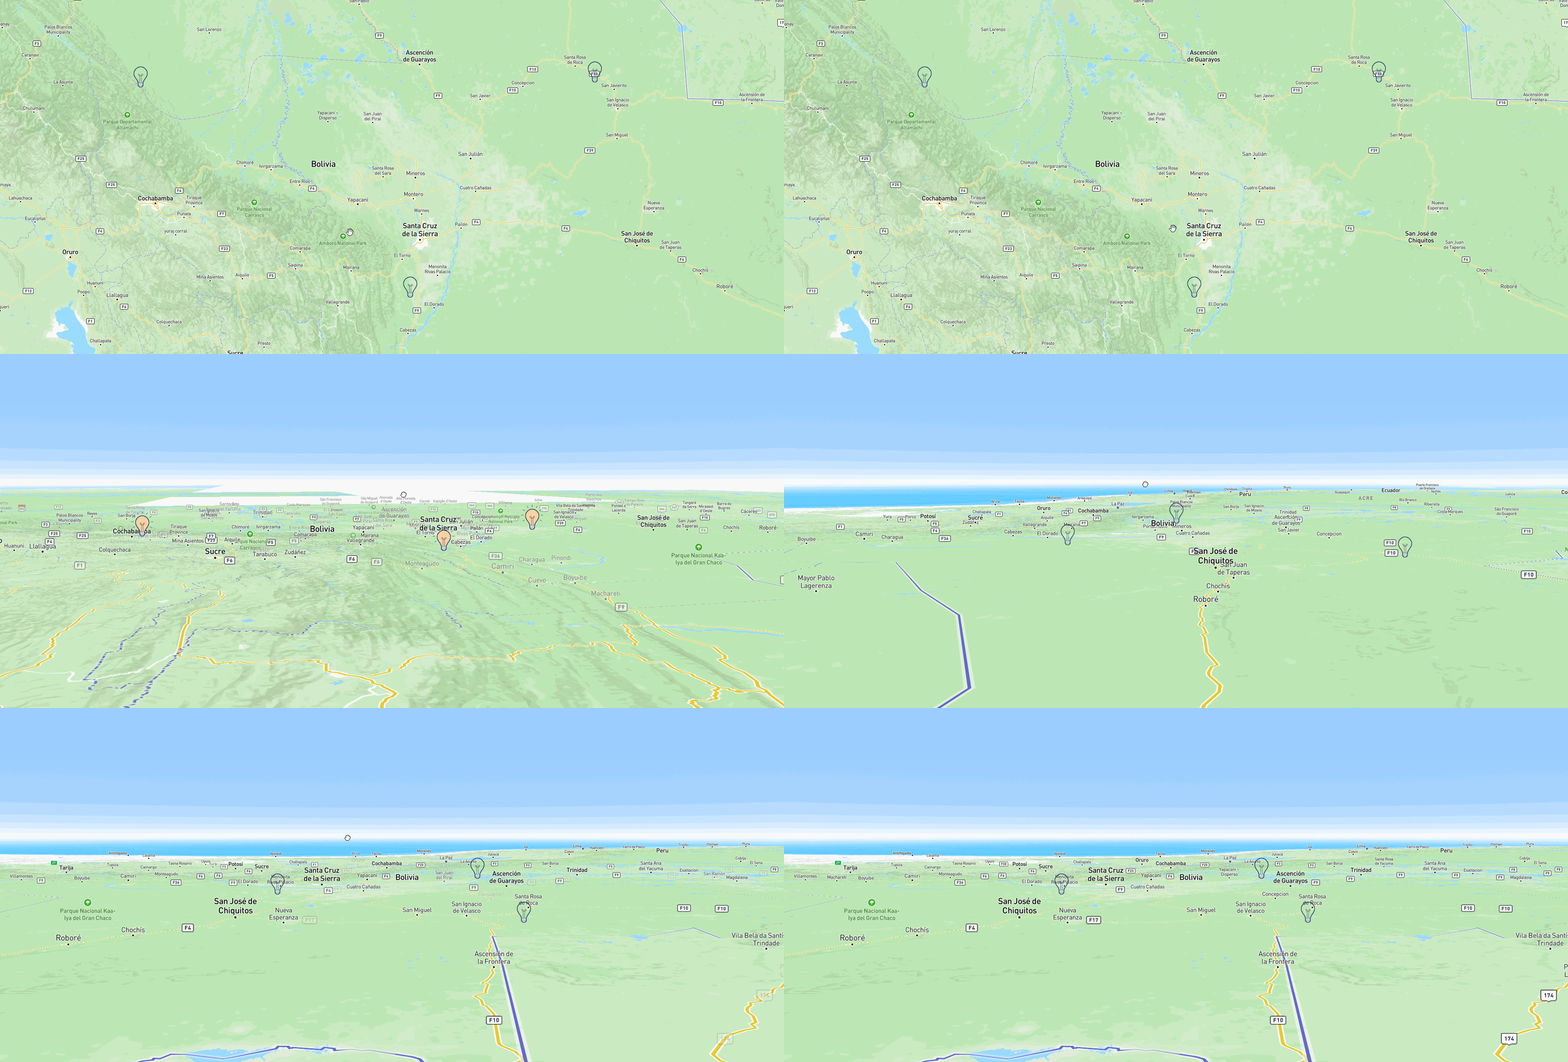
成果图

实现
该例子参考的是mapbox的这个官方例子
https://docs.mapbox.com/mapbox-gl-js/example/geojson-markers/
本来想用symbol的那个方式去写,结果发现gif的图标不行,想实现这种效果,
似乎只能采用marker的写法,但是marker的这个确实不太好操作,似乎没有layer的概念,留待以后学习,再回来改,这里是源码:
<!DOCTYPE html>
<html>
<head>
<meta charset="utf-8">
<title>Add custom icons with Markers</title>
<meta name="viewport" content="initial-scale=1,maximum-scale=1,user-scalable=no">
<link href="https://api.mapbox.com/mapbox-gl-js/v2.15.0/mapbox-gl.css" rel="stylesheet">
<script src="https://api.mapbox.com/mapbox-gl-js/v2.15.0/mapbox-gl.js"></script>
<style>
body {

     margin: 0; padding: 0; }
#map {

     position: absolute; top: 0; bottom: 0; width: 100%; }
</style>
</head>
<body>
<style>
    .marker {


        display: block;
        border: none;
        border-radius: 50%;
        cursor: pointer;
        padding: 0;
    }
</style>

<div id="map"></div>

<script>
	mapboxgl.accessToken = 'pk.eyJ1Ijoic2FrdXJhc2p5IiwiYSI6ImNsOThtZnd2bDBya2Qzd212aXdzcTJyNjcifQ.CFg6DX03N25sPliiIyjnmQ';
    const geojson = {


        'type': 'FeatureCollection',
        'features': [
            {


                'type': 'Feature',
                'properties': {


                    'message': 'Foo',
                    'iconSize': [60, 60]
                },
                'geometry': {


                    'type': 'Point',
                    'coordinates': [-66.324462, -16.024695]
                }
            },
            {


                'type': 'Feature',
                'properties': {


                    'message': 'Bar',
                    'iconSize': [50, 50]
                },
                'geometry': {


                    'type': 'Point',
                    'coordinates': [-61.21582, -15.971891]
                }
            },
            {


                'type': 'Feature',
                'properties': {


                    'message': 'Baz',
                    'iconSize': [40, 40]
                },
                'geometry': {


                    'type': 'Point',
                    'coordinates': [-63.292236, -18.281518]
                }
            }
        ]
    };

    const map = new mapboxgl.Map({


        container: 'map',
        // Choose from Mapbox's core styles, or make your own style with Mapbox Studio
        style: 'mapbox://styles/mapbox/streets-v12',
        center: [-65.017, -16.457],
        zoom: 5
    });

    // Add markers to the map.
    for (const marker of geojson.features) {


        // Create a DOM element for each marker.
        const el = document.createElement('div');
        el.className = 'marker';
        el.style.backgroundImage = `url(http://www.sucaijishi.com/uploadfile/2015/1215/20151215110434556.gif)`;
        el.style.width = '100px';
        el.style.height = '100px';
        el.style.backgroundSize = '100%';

        el.addEventListener('click', () => {


            window.alert(marker.properties.message);
        });

        // Add markers to the map.
        new mapboxgl.Marker(el)
            .setLngLat(marker.geometry.coordinates)
            .addTo(map);
    }
</script>

</body>
</html>