1.0 未调整前位置

1.1 调整后
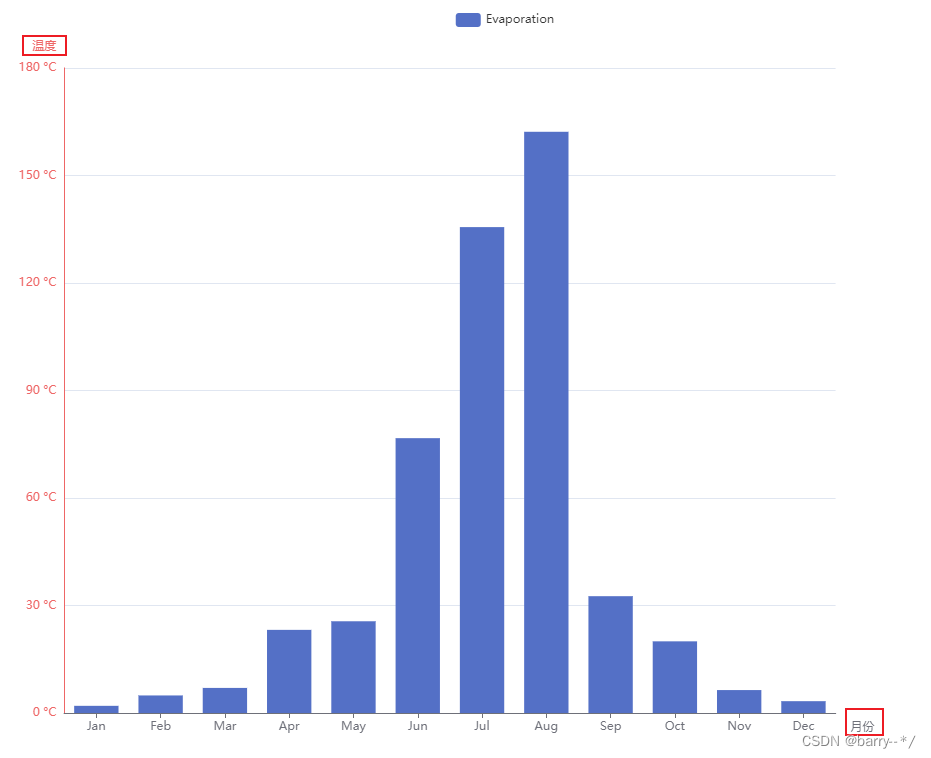
2.0 代码:
const colors = ['#5470C6', '#91CC75', '#EE6666'];
option = {
  color: colors,
  tooltip: {
    trigger: 'axis',
    axisPointer: {
      type: 'cross'
    }
  },
  grid: {
    right: '20%'
  },
  toolbox: {
    feature: {
      dataView: { show: true, readOnly: false },
      restore: { show: true },
      saveAsImage: { show: true }
    }
  },
  legend: {
    data: ['Evaporation', 'Precipitation', 'Temperature']
  },
  xAxis: [
    {
      type: 'category',
      name:'月份',//x轴标题名称
      nameTextStyle:{
        lineHeight:30, //标题行高
        verticalAlign:'top',//标题位置
      },
      axisTick: {
        alignWithLabel: true
      },
      // prettier-ignore
      data: ['Jan', 'Feb', 'Mar', 'Apr', 'May', 'Jun', 'Jul', 'Aug', 'Sep', 'Oct', 'Nov', 'Dec']
    }
  ],
  yAxis: [
    {
      type: 'value',
      name: '温度',
      nameLocation:'end',
      nameTextStyle:{
        padding:[0,0,0,-40],//控制y轴标题位置
      },

      alignTicks: true,
      axisLine: {
        show: true,
        lineStyle: {
          color: colors[2]
        }
      },
      axisLabel: {
        formatter: '{value} °C'
      }
    }
  ],
  series: [
    {
      name: 'Evaporation',
      type: 'bar',
      data: [
        2.0, 4.9, 7.0, 23.2, 25.6, 76.7, 135.6, 162.2, 32.6, 20.0, 6.4, 3.3
      ]
    }
  ]
};
3.0 加上坐标轴箭头

3.2 代码
const colors = ['#5470C6', '#91CC75', '#EE6666'];
option = {
  color: colors,
  tooltip: {
    trigger: 'axis',
    axisPointer: {
      type: 'cross'
    }
  },
  grid: {
    right: '20%'
  },
  toolbox: {
    feature: {
      dataView: { show: true, readOnly: false },
      restore: { show: true },
      saveAsImage: { show: true }
    }
  },
  legend: {
    data: ['Evaporation', 'Precipitation', 'Temperature']
  },
  xAxis: [
    {
      type: 'category',
      name:'月份',//x轴标题名称
      nameTextStyle:{
        lineHeight:30, //标题行高
        verticalAlign:'top',//标题位置
      },
      //添加箭头
      axisLine:{
        symbol:['none','path://M5,20 L5,5 L8,8 L5,2 L2,8 L5,5 L5.3,6 L5.3,20 '],
        symbolOffset:10,//箭头距离x轴末端距离
        symbolSize:[35,38]//箭头的宽高
      },
      axisTick: {
        alignWithLabel: true
      },
      // prettier-ignore
      data: ['Jan', 'Feb', 'Mar', 'Apr', 'May', 'Jun', 'Jul', 'Aug', 'Sep', 'Oct', 'Nov', 'Dec']
    }
  ],
  yAxis: [
    {
      type: 'value',
      name: '温度',
      nameLocation:'end',
      nameTextStyle:{
        padding:[0,0,0,-40],//控制y轴标题位置
      },

      alignTicks: true,
      axisLine: {
        symbol:['none','path://M5,20 L5,5 L8,8 L5,2 L2,8 L5,5 L5.3,6 L5.3,20 '],
        symbolSize:[35,38],//箭头的宽高
        symbolOffset:10,//箭头距离x轴末端距离
        show: true,
        lineStyle: {
          color: colors[2]
        }
      },
      axisLabel: {
        formatter: '{value} °C'
      }
    }
  ],
  series: [
    {
      name: 'Evaporation',
      type: 'bar',
      data: [
        2.0, 4.9, 7.0, 23.2, 25.6, 76.7, 135.6, 162.2, 32.6, 20.0, 6.4, 3.3
      ]
    }
  ]
};