构建数据可视化(基于Echarts,python)
本文目录:
一、写在前面的题外话

我们无法决定一个人的出现,也无法决定一个人的离开,你或许能做的,就是珍惜不期而遇的惊喜。前世的缘分,今生的相遇,来生的回眸。
任何类型的关系(朋友、亲戚。。。),有心者,必有所累,无心者,亦无所谓。情出自愿,不谈亏欠,一念起,天涯咫尺;一念灭,咫尺天涯。
每个人性格不同,人生经历也不同,如果因为环境等因素造成无法正常相处,不如选择礼貌退场,找回原来的自己,把别人还于人海,互不打扰。
没有谁的人生是经过铺垫顺畅无阻的,都不容易,你觉得别人比你过得好,只是因为你不曾看见他(她)疲惫不堪却不得不坚持的另一面。半生风雨半身寒,一杯浊酒敬流年,回首过往半生路,七分酸楚三分甜。
世界上,每个人都是独一无二,无可替代的。所以我们才会在不知不觉中被某件微不足道的小事物牵引,记起某个人,某个声音,某个别人的故事。。。
《再无一人恰似我》 作者:弘一法师 李叔同
旧人不知我近况,
新人不知我过往。
纵你阅人何其多,
再无一人恰似我。
逆境清醒
2023.8.27

二、数据可视化概念
数据可视化:
数据可视化是指将数据转换为图表、图形或其它形式的视觉元素,以帮助人们更好地理解和分析数据。它可以展示数据的模式、趋势、关联性和规律,有助于人们从数据中发现埋藏的价值和见解,从而更好地做出决策和行动。数据可视化涉及到多种技术和工具,包括图表、地图、网络图、热力图等。它已经成为数据分析和商业智能领域中非常重要的一部分。

实现数据可视化需要注意的事项:
- 选择合适的图表类型:不同类型的数据要使用不同类型的图表来展示。比如,使用折线图来展示趋势数据,使用饼图来展示占比数据。
- 确定数据的重点:为了呈现数据的重点,需要确保视觉元素的排列、颜色、和大小等符合数据的重点。
- 保持简洁:不要在图表中添加太多的信息,将信息保持简洁,易于理解和阅读。
- 使用色彩有效:对比色和相关色可以帮助读者更好地理解数据。不过,要避免使用过多的颜色,这会分散读者注意力。
- 选择合适的字体:使用易于阅读的字体,并确保字体大小足够大,以便读者可以轻松地阅读数据。
- 保持一致性:确保数据可视化的元素(如颜色、字体、大小)在整个视觉化项目中保持一致。
三、用Python matplotlib库绘制数据可视化图
#-*- coding: UTF-8 -*-
import matplotlib.pyplot as plt
import matplotlib as mpl
mpl.rcParams["font.sans-serif"]=["SimHei"]
mpl.rcParams["axes.unicode_minus"]=False
import matplotlib.pyplot as plt

labels = ['糯米糍', '雪梅娘', '八宝饭', '驴打滚', '甜薄撑']
values = [20, 30, 25, 15, 10]
colors = ['lightskyblue', 'yellowgreen', 'gold', 'orange', 'lightcoral']

plt.pie(values, labels=labels, colors=colors, autopct='%1.1f%%', startangle=90)
plt.axis('equal')

plt.show()
在上述代码中,我们使用了plt.pie()函数来绘制图形。
其中,
labels参数指定了每个扇形图的标签,
values参数指定了每个扇形图所占的值,
colors参数指定了每个扇形图的颜色,
autopct参数指定了每个扇形图所占的比例的显示方式,
startangle参数指定了起始角度。
最后,我们使用plt.axis('equal')来保证扇形图是一个正圆。
通过调用plt.show()来展示扇形图。

四、基于Echarts构建大数据可视化
4.1、安装echarts.js
我们需要先安装echarts,
下载地址:https://archive.apache.org/dist/echarts/5.4.3/

或者在页面代码里加入:
<script type="text/javascript" src="https://fastly.jsdelivr.net/npm/[email protected]/dist/echarts.min.js"></script>
4.2、数据可视化折线图制作
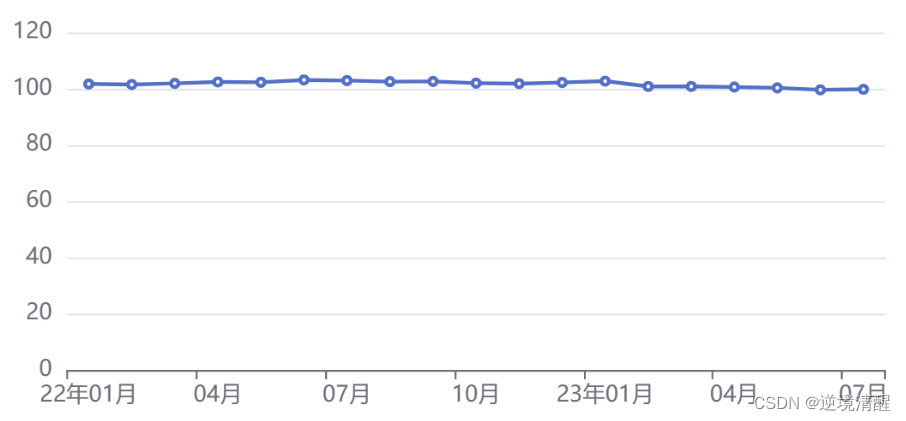
4.2.1、基础折线图
2022年1月-2023年7月广东居民消费价格指数同比走势图
代码如下:
<!DOCTYPE html>
<html lang="zh-CN" style="height: 100%">
<head>
  <meta charset="utf-8">
</head>
<body style="height: 100%; margin: 0">
  <div id="container" style="height: 100%"></div>


  <script type="text/javascript" src="https://fastly.jsdelivr.net/npm/[email protected]/dist/echarts.min.js"></script>
  <!-- Uncomment this line if you want to dataTool extension
  <script type="text/javascript" src="https://fastly.jsdelivr.net/npm/[email protected]/dist/extension/dataTool.min.js"></script>
  -->
  <!-- Uncomment this line if you want to use gl extension
  <script type="text/javascript" src="https://fastly.jsdelivr.net/npm/echarts-gl@2/dist/echarts-gl.min.js"></script>
  -->
  <!-- Uncomment this line if you want to echarts-stat extension
  <script type="text/javascript" src="https://fastly.jsdelivr.net/npm/echarts-stat@latest/dist/ecStat.min.js"></script>
  -->
  <!-- Uncomment this line if you want to use map
  <script type="text/javascript" src="https://fastly.jsdelivr.net/npm/[email protected]/map/js/china.js"></script>
  <script type="text/javascript" src="https://fastly.jsdelivr.net/npm/[email protected]/map/js/world.js"></script>
  -->
  <!-- Uncomment these two lines if you want to use bmap extension
  <script type="text/javascript" src="https://api.map.baidu.com/api?v=3.0&ak=YOUR_API_KEY"></script>
  <script type="text/javascript" src="https://fastly.jsdelivr.net/npm/[email protected]/dist/extension/bmap.min.js"></script>
  -->

  <script type="text/javascript">
    var dom = document.getElementById('container');
    var myChart = echarts.init(dom, null, {
      renderer: 'canvas',
      useDirtyRect: false
    });
    var app = {};

    var option;

    option = {
  xAxis: {
    type: 'category',
    data: ["22年01月","02月","03月","04月","05月","06月","07月","08月","09月","10月","11月","12月","23年01月","02月","03月","04月","05月","06月","07月"]
  },
  yAxis: {
    type: 'value',
  	axisTick: {
					show:false,
					alignWithLabel: true,
				},

  },
  series: [
    {
      data: [101.7,101.5,101.9,102.4,102.3,103.1,102.9,102.5,102.6,102,101.8,102.2,102.7,100.8,100.8,100.6,100.3,99.6,99.8],
      type: 'line',
    }
  ]
};

    if (option && typeof option === 'object') {
      myChart.setOption(option);
    }

    window.addEventListener('resize', myChart.resize);
  </script>
</body>
</html>
折线图数据集中在小范围内,效果不明显,我们调整一下代码:
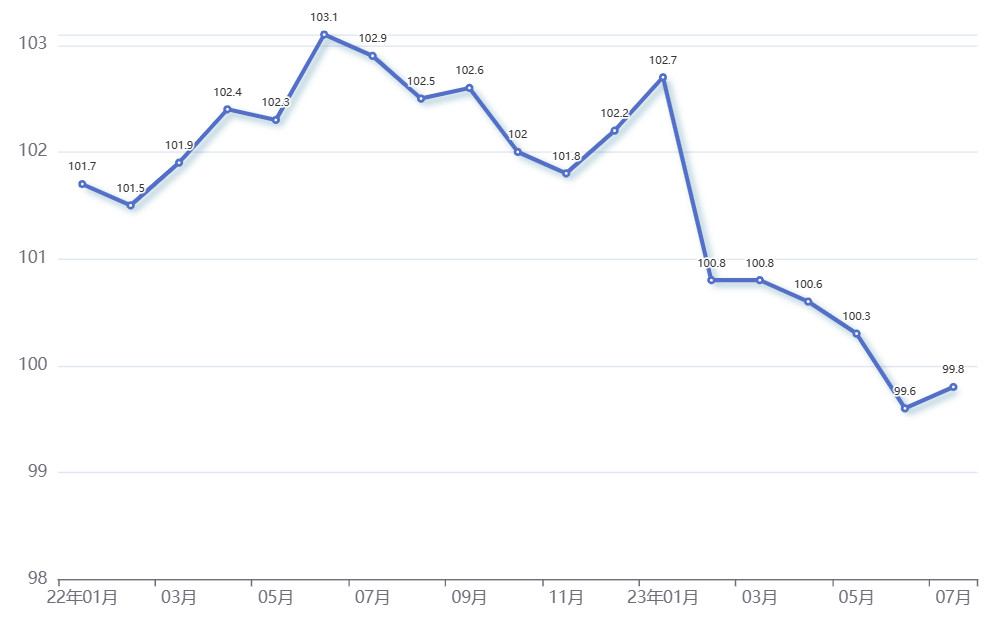
4.2.2、改善折线图
2022年1月-2023年7月广东居民消费价格指数同比走势图
代码如下:
<!DOCTYPE html>
<html lang="zh-CN" style="height: 100%">
<head>
  <meta charset="utf-8">
</head>
<body style="height: 100%; margin: 0">
  <div id="container" style="height: 100%"></div>


  <script type="text/javascript" src="https://fastly.jsdelivr.net/npm/[email protected]/dist/echarts.min.js"></script>
  <!-- Uncomment this line if you want to dataTool extension
  <script type="text/javascript" src="https://fastly.jsdelivr.net/npm/[email protected]/dist/extension/dataTool.min.js"></script>
  -->
  <!-- Uncomment this line if you want to use gl extension
  <script type="text/javascript" src="https://fastly.jsdelivr.net/npm/echarts-gl@2/dist/echarts-gl.min.js"></script>
  -->
  <!-- Uncomment this line if you want to echarts-stat extension
  <script type="text/javascript" src="https://fastly.jsdelivr.net/npm/echarts-stat@latest/dist/ecStat.min.js"></script>
  -->
  <!-- Uncomment this line if you want to use map
  <script type="text/javascript" src="https://fastly.jsdelivr.net/npm/[email protected]/map/js/china.js"></script>
  <script type="text/javascript" src="https://fastly.jsdelivr.net/npm/[email protected]/map/js/world.js"></script>
  -->
  <!-- Uncomment these two lines if you want to use bmap extension
  <script type="text/javascript" src="https://api.map.baidu.com/api?v=3.0&ak=YOUR_API_KEY"></script>
  <script type="text/javascript" src="https://fastly.jsdelivr.net/npm/[email protected]/dist/extension/bmap.min.js"></script>
  -->

  <script type="text/javascript">
    var dom = document.getElementById('container');
    var myChart = echarts.init(dom, null, {
      renderer: 'canvas',
      useDirtyRect: false
    });
    var app = {};

    var option;

    option = {
  grid: {
    left: '3%',
    right: '4%',
    bottom: '1%',
    containLabel: true
  },
  xAxis: {
    type: 'category',
    data: ["22年01月","02月","03月","04月","05月","06月","07月","08月","09月","10月","11月","12月","23年01月","02月","03月","04月","05月","06月","07月"]
  },
  yAxis: {
    type: 'value',
  	axisTick: {
		show:false,
		alignWithLabel: true,
	},
  minInterval: 1, //最小刻度是1
  splitNumber: 4, //段数是4
  min: 98, //最小是0
  max: function (value) { //最大设定
  if (value.max < 4) {return 4;}
  else {return value.max;}

},
  },
  series: [
    {
      itemStyle : { normal: {label : {show: true,fontSize:8},}}, //可以显示数字
      data: [101.7,101.5,101.9,102.4,102.3,103.1,102.9,102.5,102.6,102,101.8,102.2,102.7,100.8,100.8,100.6,100.3,99.6,99.8],
      type: 'line',
      lineStyle: {
        width: 3,
        type: 'singleAxis',
        shadowColor : 'rgba(2, 89, 133,0.4)', //默认透明
        shadowBlur: 5,
        shadowOffsetX: 3,
        shadowOffsetY: 3,
        type:'solid'  // 虚线'dotted' 实线'solid'
        }
    }
  ]
};

    if (option && typeof option === 'object') {
      myChart.setOption(option);
    }

    window.addEventListener('resize', myChart.resize);
  </script>
</body>
</html>
我们将折线图改成平滑折线图:
4.2.3、平滑折线图
2022年1月-2023年7月广东居民消费价格指数同比走势图

代码如下:
<!DOCTYPE html>
<html lang="zh-CN" style="height: 100%">
<head>
<meta charset="utf-8">
</head>
<body style="height: 100%; margin: 0">
<div id="container" style="height: 100%"></div>
<script type="text/javascript" src="https://fastly.jsdelivr.net/npm/[email protected]/dist/echarts.min.js"></script>
<!-- Uncomment this line if you want to dataTool extension
<script type="text/javascript" src="https://fastly.jsdelivr.net/npm/[email protected]/dist/extension/dataTool.min.js"></script>
-->
<!-- Uncomment this line if you want to use gl extension
<script type="text/javascript" src="https://fastly.jsdelivr.net/npm/echarts-gl@2/dist/echarts-gl.min.js"></script>
-->
<!-- Uncomment this line if you want to echarts-stat extension
<script type="text/javascript" src="https://fastly.jsdelivr.net/npm/echarts-stat@latest/dist/ecStat.min.js"></script>
-->
<!-- Uncomment this line if you want to use map
<script type="text/javascript" src="https://fastly.jsdelivr.net/npm/[email protected]/map/js/china.js"></script>
<script type="text/javascript" src="https://fastly.jsdelivr.net/npm/[email protected]/map/js/world.js"></script>
-->
<!-- Uncomment these two lines if you want to use bmap extension
<script type="text/javascript" src="https://api.map.baidu.com/api?v=3.0&ak=YOUR_API_KEY"></script>
<script type="text/javascript" src="https://fastly.jsdelivr.net/npm/[email protected]/dist/extension/bmap.min.js"></script>
-->
<script type="text/javascript">
var dom = document.getElementById('container');
var myChart = echarts.init(dom, null, {
renderer: 'canvas',
useDirtyRect: false
});
var app = {};
var option;
option = {
grid: {
left: '3%',
right: '4%',
bottom: '1%',
containLabel: true
},
xAxis: {
type: 'category',
data: ["22年01月","02月","03月","04月","05月","06月","07月","08月","09月","10月","11月","12月","23年01月","02月","03月","04月","05月","06月","07月"]
},
yAxis: {
type: 'value',
axisTick: {
show:false,
alignWithLabel: true,
},
minInterval: 1, //最小刻度是1
splitNumber: 4, //段数是4
min: 98, //最小是0
max: function (value) { //最大设定
if (value.max < 4) {return 4;}
else {return value.max;}
},
},
series: [
{
itemStyle : { normal: {label : {show: true,fontSize:8},}}, //可以显示数字
data: [101.7,101.5,101.9,102.4,102.3,103.1,102.9,102.5,102.6,102,101.8,102.2,102.7,100.8,100.8,100.6,100.3,99.6,99.8],
type: 'line',
smooth: true,
}
]
};
if (option && typeof option === 'object') {
myChart.setOption(option);
}
window.addEventListener('resize', myChart.resize);
</script>
</body>
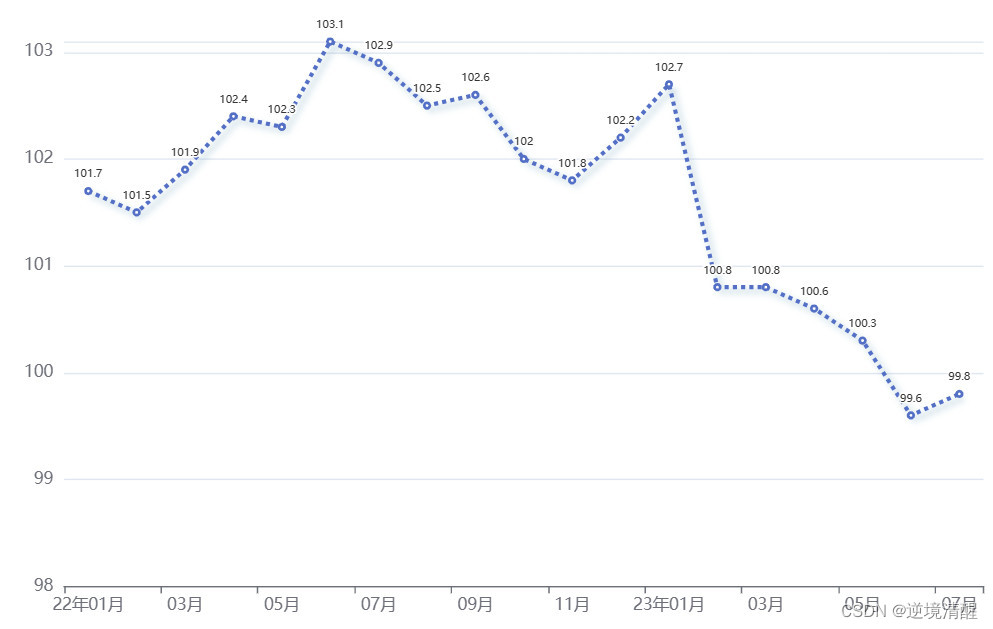
</html>4.2.4、虚线折线图
2022年1月-2023年7月广东居民消费价格指数同比走势图
<!DOCTYPE html>
<html lang="zh-CN" style="height: 100%">
<head>
<meta charset="utf-8">
</head>
<body style="height: 100%; margin: 0">
<div id="container" style="height: 100%"></div>
<script type="text/javascript" src="https://fastly.jsdelivr.net/npm/[email protected]/dist/echarts.min.js"></script>
<!-- Uncomment this line if you want to dataTool extension
<script type="text/javascript" src="https://fastly.jsdelivr.net/npm/[email protected]/dist/extension/dataTool.min.js"></script>
-->
<!-- Uncomment this line if you want to use gl extension
<script type="text/javascript" src="https://fastly.jsdelivr.net/npm/echarts-gl@2/dist/echarts-gl.min.js"></script>
-->
<!-- Uncomment this line if you want to echarts-stat extension
<script type="text/javascript" src="https://fastly.jsdelivr.net/npm/echarts-stat@latest/dist/ecStat.min.js"></script>
-->
<!-- Uncomment this line if you want to use map
<script type="text/javascript" src="https://fastly.jsdelivr.net/npm/[email protected]/map/js/china.js"></script>
<script type="text/javascript" src="https://fastly.jsdelivr.net/npm/[email protected]/map/js/world.js"></script>
-->
<!-- Uncomment these two lines if you want to use bmap extension
<script type="text/javascript" src="https://api.map.baidu.com/api?v=3.0&ak=YOUR_API_KEY"></script>
<script type="text/javascript" src="https://fastly.jsdelivr.net/npm/[email protected]/dist/extension/bmap.min.js"></script>
-->
<script type="text/javascript">
var dom = document.getElementById('container');
var myChart = echarts.init(dom, null, {
renderer: 'canvas',
useDirtyRect: false
});
var app = {};
var option;
option = {
grid: {
left: '3%',
right: '4%',
bottom: '1%',
containLabel: true
},
xAxis: {
type: 'category',
data: ["22年01月","02月","03月","04月","05月","06月","07月","08月","09月","10月","11月","12月","23年01月","02月","03月","04月","05月","06月","07月"]
},
yAxis: {
type: 'value',
axisTick: {
show:false,
alignWithLabel: true,
},
minInterval: 1, //最小刻度是1
splitNumber: 4, //段数是4
min: 98, //最小是0
max: function (value) { //最大设定
if (value.max < 4) {return 4;}
else {return value.max;}
},
},
series: [
{
itemStyle : { normal: {label : {show: true,fontSize:8},}}, //可以显示数字
//name: 'Step End',
data: [101.7,101.5,101.9,102.4,102.3,103.1,102.9,102.5,102.6,102,101.8,102.2,102.7,100.8,100.8,100.6,100.3,99.6,99.8],
type: 'line',
lineStyle: {
width: 3,
type: 'singleAxis',
shadowColor : 'rgba(2, 89, 133,0.4)', //默认透明
shadowBlur: 5,
shadowOffsetX: 3,
shadowOffsetY: 3,
type:'dotted' // 虚线'dotted' 实线'solid'
}
}
]
};
if (option && typeof option === 'object') {
myChart.setOption(option);
}
window.addEventListener('resize', myChart.resize);
</script>
</body>
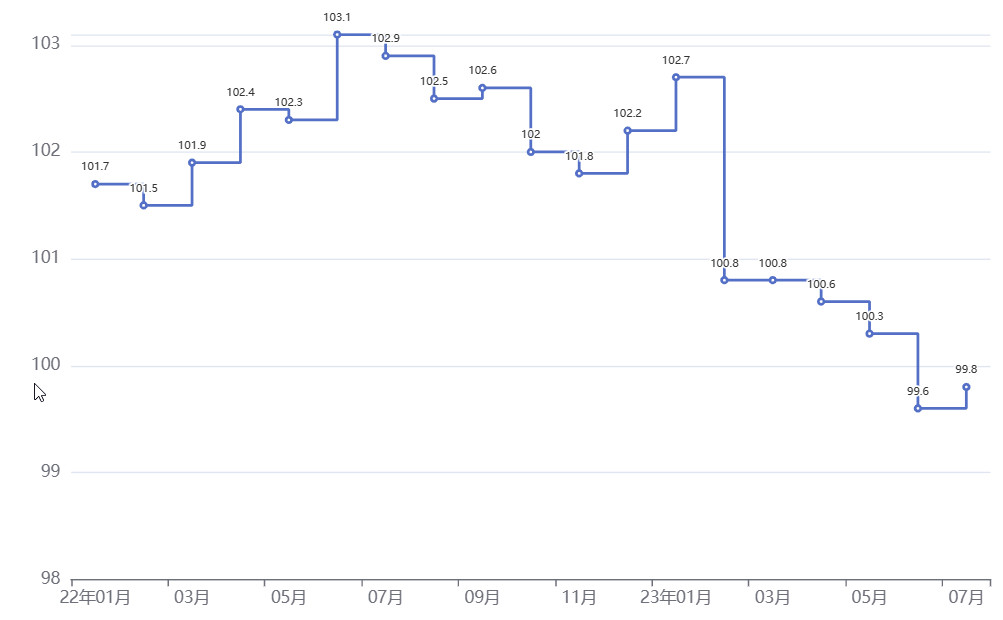
</html>4.2.5、阶梯折线图
2022年1月-2023年7月广东居民消费价格指数同比走势图
<!DOCTYPE html>
<html lang="zh-CN" style="height: 100%">
<head>
  <meta charset="utf-8">
</head>
<body style="height: 100%; margin: 0">
  <div id="container" style="height: 100%"></div>


  <script type="text/javascript" src="https://fastly.jsdelivr.net/npm/[email protected]/dist/echarts.min.js"></script>
  <!-- Uncomment this line if you want to dataTool extension
  <script type="text/javascript" src="https://fastly.jsdelivr.net/npm/[email protected]/dist/extension/dataTool.min.js"></script>
  -->
  <!-- Uncomment this line if you want to use gl extension
  <script type="text/javascript" src="https://fastly.jsdelivr.net/npm/echarts-gl@2/dist/echarts-gl.min.js"></script>
  -->
  <!-- Uncomment this line if you want to echarts-stat extension
  <script type="text/javascript" src="https://fastly.jsdelivr.net/npm/echarts-stat@latest/dist/ecStat.min.js"></script>
  -->
  <!-- Uncomment this line if you want to use map
  <script type="text/javascript" src="https://fastly.jsdelivr.net/npm/[email protected]/map/js/china.js"></script>
  <script type="text/javascript" src="https://fastly.jsdelivr.net/npm/[email protected]/map/js/world.js"></script>
  -->
  <!-- Uncomment these two lines if you want to use bmap extension
  <script type="text/javascript" src="https://api.map.baidu.com/api?v=3.0&ak=YOUR_API_KEY"></script>
  <script type="text/javascript" src="https://fastly.jsdelivr.net/npm/[email protected]/dist/extension/bmap.min.js"></script>
  -->

  <script type="text/javascript">
    var dom = document.getElementById('container');
    var myChart = echarts.init(dom, null, {
      renderer: 'canvas',
      useDirtyRect: false
    });
    var app = {};

    var option;

    option = {
  grid: {
    left: '3%',
    right: '4%',
    bottom: '1%',
    containLabel: true
  },
  xAxis: {
    type: 'category',
    data: ["22年01月","02月","03月","04月","05月","06月","07月","08月","09月","10月","11月","12月","23年01月","02月","03月","04月","05月","06月","07月"]
  },
  yAxis: {
    type: 'value',
  	axisTick: {
	show:false,
	alignWithLabel: true,
  },
	minInterval: 1, //最小刻度是1
  splitNumber: 4, //段数是4
  min: 98, //最小是0
  max: function (value) { //最大设定
  if (value.max < 4) {return 4;}
  else {return value.max;}

},

  },
  series: [
    {
      itemStyle : { normal: {label : {show: true,fontSize:8},}}, //可以显示数字
      data: [101.7,101.5,101.9,102.4,102.3,103.1,102.9,102.5,102.6,102,101.8,102.2,102.7,100.8,100.8,100.6,100.3,99.6,99.8],
      type: 'line',
      step: 'end',

    }
  ]
};

    if (option && typeof option === 'object') {
      myChart.setOption(option);
    }

    window.addEventListener('resize', myChart.resize);
  </script>
</body>
</html>
4.2.6、面积折线图
2022年1月-2023年7月广东居民消费价格指数同比走势图

<!DOCTYPE html>
<html lang="zh-CN" style="height: 100%">
<head>
<meta charset="utf-8">
</head>
<body style="height: 100%; margin: 0">
<div id="container" style="height: 100%"></div>
<script type="text/javascript" src="https://fastly.jsdelivr.net/npm/[email protected]/dist/echarts.min.js"></script>
<!-- Uncomment this line if you want to dataTool extension
<script type="text/javascript" src="https://fastly.jsdelivr.net/npm/[email protected]/dist/extension/dataTool.min.js"></script>
-->
<!-- Uncomment this line if you want to use gl extension
<script type="text/javascript" src="https://fastly.jsdelivr.net/npm/echarts-gl@2/dist/echarts-gl.min.js"></script>
-->
<!-- Uncomment this line if you want to echarts-stat extension
<script type="text/javascript" src="https://fastly.jsdelivr.net/npm/echarts-stat@latest/dist/ecStat.min.js"></script>
-->
<!-- Uncomment this line if you want to use map
<script type="text/javascript" src="https://fastly.jsdelivr.net/npm/[email protected]/map/js/china.js"></script>
<script type="text/javascript" src="https://fastly.jsdelivr.net/npm/[email protected]/map/js/world.js"></script>
-->
<!-- Uncomment these two lines if you want to use bmap extension
<script type="text/javascript" src="https://api.map.baidu.com/api?v=3.0&ak=YOUR_API_KEY"></script>
<script type="text/javascript" src="https://fastly.jsdelivr.net/npm/[email protected]/dist/extension/bmap.min.js"></script>
-->
<script type="text/javascript">
var dom = document.getElementById('container');
var myChart = echarts.init(dom, null, {
renderer: 'canvas',
useDirtyRect: false
});
var app = {};
var option;
option = {
grid: {
left: '3%',
right: '4%',
bottom: '1%',
containLabel: true
},
xAxis: {
type: 'category',
data: ["22年01月","02月","03月","04月","05月","06月","07月","08月","09月","10月","11月","12月","23年01月","02月","03月","04月","05月","06月","07月"]
},
yAxis: {
type: 'value',
axisTick: {
show:false,
alignWithLabel: true,
},
minInterval: 1, //最小刻度是1
splitNumber: 4, //段数是4
min: 98, //最小是0
max: function (value) { //最大设定
if (value.max < 4) {return 4;}
else {return value.max;}
},
},
series: [
{
itemStyle : { normal: {label : {show: true,fontSize:8},}}, //可以显示数字
data: [101.7,101.5,101.9,102.4,102.3,103.1,102.9,102.5,102.6,102,101.8,102.2,102.7,100.8,100.8,100.6,100.3,99.6,99.8],
type: 'line',
areaStyle: {},
}
]
};
if (option && typeof option === 'object') {
myChart.setOption(option);
}
window.addEventListener('resize', myChart.resize);
</script>
</body>
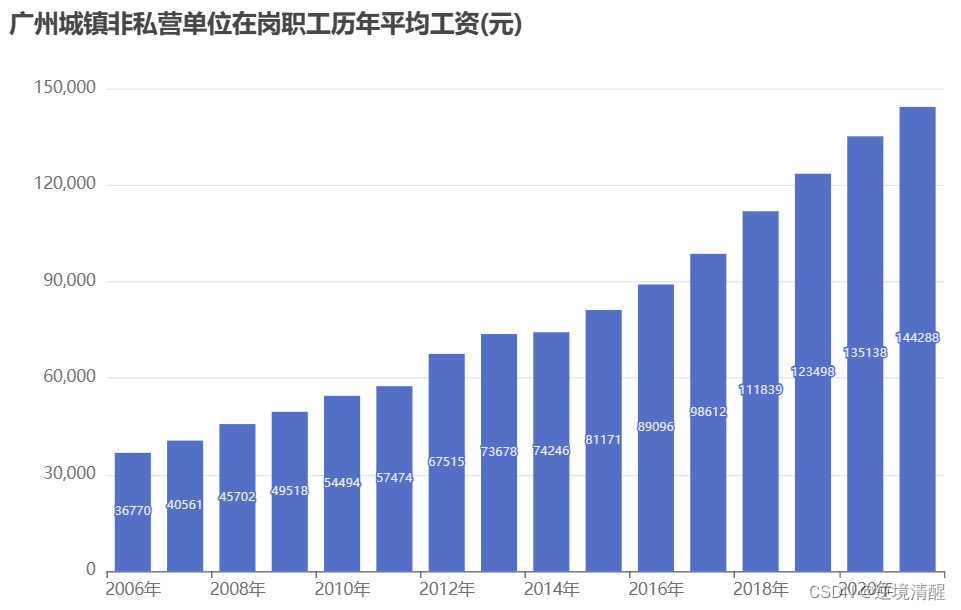
</html>4.3、数据可视化柱状图制作
<!DOCTYPE html>
<html lang="zh-CN" style="height: 100%">
<head>
<meta charset="utf-8">
</head>
<body style="height: 100%; margin: 0">
<div id="container" style="height: 100%"></div>
<script type="text/javascript" src="https://fastly.jsdelivr.net/npm/[email protected]/dist/echarts.min.js"></script>
<!-- Uncomment this line if you want to dataTool extension
<script type="text/javascript" src="https://fastly.jsdelivr.net/npm/[email protected]/dist/extension/dataTool.min.js"></script>
-->
<!-- Uncomment this line if you want to use gl extension
<script type="text/javascript" src="https://fastly.jsdelivr.net/npm/echarts-gl@2/dist/echarts-gl.min.js"></script>
-->
<!-- Uncomment this line if you want to echarts-stat extension
<script type="text/javascript" src="https://fastly.jsdelivr.net/npm/echarts-stat@latest/dist/ecStat.min.js"></script>
-->
<!-- Uncomment this line if you want to use map
<script type="text/javascript" src="https://fastly.jsdelivr.net/npm/[email protected]/map/js/china.js"></script>
<script type="text/javascript" src="https://fastly.jsdelivr.net/npm/[email protected]/map/js/world.js"></script>
-->
<!-- Uncomment these two lines if you want to use bmap extension
<script type="text/javascript" src="https://api.map.baidu.com/api?v=3.0&ak=YOUR_API_KEY"></script>
<script type="text/javascript" src="https://fastly.jsdelivr.net/npm/[email protected]/dist/extension/bmap.min.js"></script>
-->
<script type="text/javascript">
var dom = document.getElementById('container');
var myChart = echarts.init(dom, null, {
renderer: 'canvas',
useDirtyRect: false
});
var app = {};
var option;
option = {
title: {
text: '广州城镇非私营单位在岗职工历年平均工资(元)'
},
xAxis: {
type: 'category',
data: [
'2006年',
'2007年',
'2008年',
'2009年',
'2010年',
'2011年',
'2012年',
'2013年',
'2014年',
'2015年',
'2016年',
'2017年',
'2018年',
'2019年',
'2020年',
'2021年'
],
},
yAxis: {
type: 'value'
},
series: [
{
itemStyle : { normal: {label : {show: true,fontSize:9},}}, //可以显示数字
data: [
'36770',
'40561',
'45702',
'49518',
'54494',
'57474',
'67515',
'73678',
'74246',
'81171',
'89096',
'98612',
'111839',
'123498',
'135138',
'144288'
],
type: 'bar'
}
]
};
if (option && typeof option === 'object') {
myChart.setOption(option);
}
window.addEventListener('resize', myChart.resize);
</script>
</body>
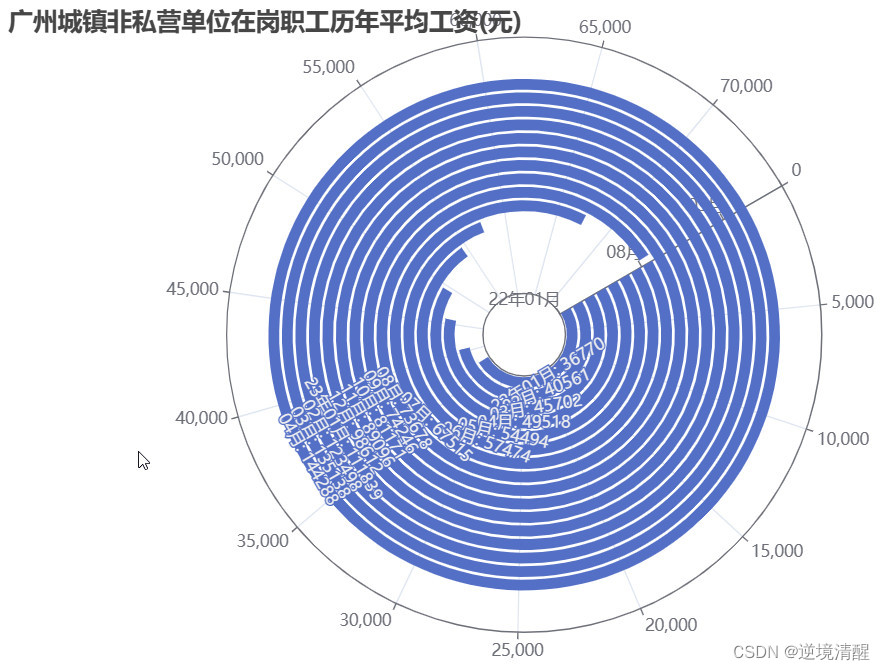
</html>4.4、数据可视化极坐标柱状图制作
<!DOCTYPE html>
<html lang="zh-CN" style="height: 100%">
<head>
  <meta charset="utf-8">
</head>
<body style="height: 100%; margin: 0">
  <div id="container" style="height: 100%"></div>


  <script type="text/javascript" src="https://fastly.jsdelivr.net/npm/[email protected]/dist/echarts.min.js"></script>
  <!-- Uncomment this line if you want to dataTool extension
  <script type="text/javascript" src="https://fastly.jsdelivr.net/npm/[email protected]/dist/extension/dataTool.min.js"></script>
  -->
  <!-- Uncomment this line if you want to use gl extension
  <script type="text/javascript" src="https://fastly.jsdelivr.net/npm/echarts-gl@2/dist/echarts-gl.min.js"></script>
  -->
  <!-- Uncomment this line if you want to echarts-stat extension
  <script type="text/javascript" src="https://fastly.jsdelivr.net/npm/echarts-stat@latest/dist/ecStat.min.js"></script>
  -->
  <!-- Uncomment this line if you want to use map
  <script type="text/javascript" src="https://fastly.jsdelivr.net/npm/[email protected]/map/js/china.js"></script>
  <script type="text/javascript" src="https://fastly.jsdelivr.net/npm/[email protected]/map/js/world.js"></script>
  -->
  <!-- Uncomment these two lines if you want to use bmap extension
  <script type="text/javascript" src="https://api.map.baidu.com/api?v=3.0&ak=YOUR_API_KEY"></script>
  <script type="text/javascript" src="https://fastly.jsdelivr.net/npm/[email protected]/dist/extension/bmap.min.js"></script>
  -->

  <script type="text/javascript">
    var dom = document.getElementById('container');
    var myChart = echarts.init(dom, null, {
      renderer: 'canvas',
      useDirtyRect: false
    });
    var app = {};

    var option;

    option = {
  title: [
    {
      text: '广州城镇非私营单位在岗职工历年平均工资(元)'
    }
  ],
  polar: {
    radius: [30, '90%']
  },
  angleAxis: {
    max:74246,
    startAngle: 30
  },
  radiusAxis: {
    type: 'category',
    data: ["22年01月","02月","03月","04月","05月","06月","07月","08月","09月","10月","11月","12月","23年01月","02月","03月","04月","05月","06月","07月"],
  },
  tooltip: {},
  series: {
    type: 'bar',
    data: [
        '36770',
        '40561',
        '45702',
        '49518',
        '54494',
        '57474',
        '67515',
        '73678',
        '74246',
        '81171',
        '89096',
        '98612',
        '111839',
        '123498',
        '135138',
        '144288'
      ],
    coordinateSystem: 'polar',
    label: {
      show: true,
      position: 'middle',
      formatter: '{b}: {c}'
    }
  }
};

    if (option && typeof option === 'object') {
      myChart.setOption(option);
    }

    window.addEventListener('resize', myChart.resize);
  </script>
</body>
</html>
大数据文章:
- 大数据(一)定义、特性
- 大数据(二)大数据行业相关统计数据
- 大数据(三)大数据相关的职位
- 基于Echarts构建大数据可视化大屏
- 大数据(四)主流大数据技术
推荐阅读:
|
|
|
|
| 给照片换底色(python+opencv) | 猫十二分类 | 基于大模型的虚拟数字人__虚拟主播实例 |
|
|
|
|
| 计算机视觉__基本图像操作(显示、读取、保存) | 直方图(颜色直方图、灰度直方图) | 直方图均衡化(调节图像亮度、对比度) |
|
|
|
|


|
|
||
|
|
||
| Three.js实例详解___旋转的精灵女孩(附完整代码和资源)(一) | ||
|
|
|
|
| 立体多层玫瑰绘图源码__玫瑰花python 绘图源码集锦 | ||
|
|
|
|
| 用代码写出浪漫__合集(python、matplotlib、Matlab、java绘制爱心、玫瑰花、前端特效玫瑰、爱心) |
python爱心源代码集锦(18款) | |
|
|
|
|
|
|
|
|
| 用代码过中秋,python海龟月饼你要不要尝一口? | ||
|
|
|
|
| 草莓熊python turtle绘图(风车版)附源代码 | ||
|
|
|
|
| 皮卡丘python turtle海龟绘图(电力球版)附源代码 | ||


|
|
|
|
| 2023年4月多家权威机构____编程语言排行榜__薪酬状况 | ||
|
|
|
|
| 【CSDN云IDE】个人使用体验和建议(含超详细操作教程)(python、webGL方向) | ||


|
|
|
|