文章目录
-
- 前言
- “Why Should I Trust You?” Explaining the Predictions of Any Classifier
-
- 摘要
- 1 介绍
- 2 The Case for Explanations 解释的理由
- 3 Local Interpretable Model-Agnostic Explanations 局部可解释模型不可知解释
- 4 Submodular Pick for Explaining Models 用于解释模型的子模块选取
- 5 Simulated User Experiments 模拟用户实验
- 6 Evaluation with Human Subjects 人体评价
- 7 Related Work 相关工作
- 8 Conclusion and Future Work 结论与未来工作
- References 参考文献
- 总结
前言
有关可解释性文章LIME的翻译
“Why Should I Trust You?” Explaining the Predictions of Any Classifier
“我为什么要相信你?”解释任何一个分类器的预测
-
原文链接:https://arxiv.org/pdf/1602.04938v1.pdf
-
代码链接:https://github.com/marcotcr/lime-experiments
-
作者信息:
姓名 地址 邮箱 Marco Tulio Ribeiro University of Washington Seattle, WA 98105, USA [email protected] Sameer Singh University of Washington Seattle, WA 98105, USA [email protected] Carlos Guestrin University of Washington Seattle, WA 98105, USA [email protected]
摘要
Despite widespread adoption, machine learning models remain mostly black boxes. Understanding the reasons behind predictions is, however, quite important in assessing trust in a model. Trust is fundamental if one plans to take action based on a prediction, or when choosing whether or not to deploy a new model. Such understanding further provides insights into the model, which can be used to turn an untrustworthy model or prediction into a trustworthy one.
尽管被广泛采用,机器学习模型仍然大多是黑匣子。然而,理解预测背后的原因对于评估模型中的信任是非常重要的。如果一个人计划根据预测采取行动,或者在选择是否部署新模型时,信任是至关重要的。这种理解进一步提供了对模型的洞察,可用于将不可信的模型或预测转化为可信的模型或预测。
In this work, we propose LIME, a novel explanation technique that explains the predictions of any classifier in an interpretable and faithful manner, by learning an interpretable model locally around the prediction. We further propose a method to explain models by presenting representative individual predictions and their explanations in a non-redundant way, framing the task as a submodular optimization problem. We demonstrate the flexibility of these methods by explaining different models for text (e.g. random forests) and image classification (e.g. neural networks). The usefulness of explanations is shown via novel experiments, both simulated and with human subjects. Our explanations empower users in various scenarios that require trust: deciding if one should trust a prediction, choosing between models, improving an untrustworthy classifier, and detecting why a classifier should not be trusted.
在这项工作中,我们提出了LIME,一种新的解释技术,通过在预测周围局部学习一个可解释的模型,以一种可解释和忠实的方式解释任何分类器的预测。我们进一步提出了一种解释模型的方法,即以非冗余的方式呈现具有代表性的个体预测及其解释,将任务框架化为子模块优化问题。我们通过解释文本(如随机森林)和图像分类(如神经网络)的不同模型来证明这些方法的灵活性。通过模拟实验和人体实验证明了解释的有效性。我们的解释使用户能够在各种需要信任的场景中使用:决定是否应该信任预测、在模型之间进行选择、改进不值得信任的分类器以及检测为什么不应该信任分类器。
1 介绍
Machine learning is at the core of many recent advances in science and technology. Unfortunately, the important role of humans is an oft-overlooked aspect in the field. Whether humans are directly using machine learning classifiers as tools, or are deploying models into products that need to be shipped, a vital concern remains: if the users do not trust a model or a prediction, they will not use it. It is important to differentiate between two different (but related) definitions of trust: (1) trusting a prediction, i.e. whether a user trusts an individual prediction sufficiently to take some action based on it, and (2) trusting a model, i.e. whether the user trusts a model to behave in reasonable ways if deployed. Both are directly impacted by how much the human understands a model’s behaviour, as opposed to seeing it as a black box.
机器学习是最近许多科学技术进步的核心。不幸的是,人类的重要作用是该领域经常被忽视的一个方面。无论人类是直接使用机器学习分类器作为工具,还是将模型部署到需要发货的产品中,一个至关重要的问题仍然存在:如果用户不信任模型或预测,他们就不会使用它。区分信任的两个不同(但相关)定义很重要:(1)信任预测,即用户是否充分信任某个预测,以便在其基础上采取某些行动;(2)信任模型,即用户是否信任模型,以便在部署时以合理的方式行事。两者都受到人类对模型行为理解程度的直接影响,而不是将其视为一个黑匣子。
Determining trust in individual predictions is an important problem when the model is used for real world actions. When using machine learning for medical diagnosis [6] or terrorism detection, for example, predictions cannot be acted upon on blind faith, as the consequences may be catastrophic. Apart from trusting individual predictions, there is also a need to evaluate the model as a whole before deploying it “in the wild”. To make this decision, users need to be confident that the model will perform well on real-world data, according to the metrics of interest. Currently, models are evaluated using metrics such as accuracy on an available validation dataset. However, real-world data is often significantly different, and further, the evaluation metric may not be indicative of the product’s goal. Inspecting individual predictions and their explanations can be a solution to this problem, in addition to such metrics. In this case, it is important to guide users by suggesting which instances to inspect, especially for larger datasets.
当模型用于现实世界的行动时,确定个体预测中的信任度是一个重要的问题。例如,当使用机器学习进行医学诊断[6]或恐怖主义检测时,预测不能盲目地采取行动,因为后果可能是灾难性的。除了相信个别预测之外,在“野外”部署模型之前,还需要对模型进行整体评估。为了做出这个决定,用户需要有信心,根据感兴趣的指标,该模型将在真实世界的数据上表现良好。目前,模型是使用可用验证数据集上的精度等指标进行评估的。然而,现实世界中的数据往往有很大的不同,而且,评估指标可能无法表明产品的目标。除了这些度量之外,检查单个预测及其解释可以解决这个问题。在这种情况下,重要的是通过建议要检查哪些实例来指导用户,特别是对于较大的数据集。
In this paper, we propose providing explanations for individual predictions as a solution to the “trusting a prediction” problem, and selecting multiple such predictions (and explanations) as a solution to the “trusting the model” problem. Our main contributions are summarized as follows.
在这篇文章中,我们建议提供个别预测的解释作为“信任预测”问题的解决方案,并选择多个这样的预测(和解释)作为“信任模型”问题的解决方案。我们的主要贡献总结如下。
-
LIME, an algorithm that can explain the predictions of any classifier or regressor in a faithful way, by approximating it locally with an interpretable model.
-
LIME是一种算法,它可以用一个可解释的模型局部地逼近任何分类器或回归器的预测,从而以一种可靠的方式来解释它。
-
SP-LIME, a method that selects a set of representative instances with explanations to address the “trusting the model” problem, via submodular optimization.
-
SP-LIME是一种选择一组具有代表性的实例,并通过子模块优化来解决信任模型问题的算法。
-
Comprehensive evaluation with simulated and human subjects, where we measure the impact of explanations on trust and associated tasks. In our experiments, non-experts using LIME are able to pick which classifier from a pair generalizes better in the real world. Further, they are able to greatly improve an untrustworthy classifier trained on 20 newsgroups, by doing feature engineering using LIME. We also show how understanding the predictions of a neural network on images helps practitioners know when and why they should not trust a model.
-
通过模拟和人体实验进行综合评估,我们测量解释对信任和相关任务的影响。在我们的实验中,使用LIME的非专家能够从一对分类器中挑选出在现实世界中泛化更好的分类器。此外,通过使用LIME进行特征工程,他们能够极大地改进在20个新闻组上训练的不可信分类器。我们还展示了理解神经网络对图像的预测如何帮助实践者知道何时以及为什么他们不应该信任模型。
2 The Case for Explanations 解释的理由
By “explaining a prediction”, we mean presenting textual or visual artifacts that provide qualitative understanding of the relationship between the instance’s components (e.g. words in text, patches in an image) and the model’s prediction. We argue that explaining predictions is an important aspect in getting humans to trust and use machine learning effectively, provided the explanations are faithful and intelligible.
通过“解释预测”,我们的意思是呈现文本或视觉工件,提供对实例组件(例如文本中的单词、图像中的补丁)和模型预测之间关系的定性理解。我们认为,解释预测是一个重要的方面,让人类信任和使用机器学习有效,只要解释是可信的和可理解的。
The process of explaining individual predictions is illustrated in Figure 1. It is clear that a doctor is much better positioned to make a decision with the help of a model if intelligible explanations are provided. In this case, explanations are a small list of symptoms with relative weights - symptoms that either contribute towards the prediction (in green) or are evidence against it (in red). In this, and other examples where humans make decisions with the help of predictions, trust is of fundamental concern. Even when stakes are lower, as in product or movie recommendations, the user needs to trust the prediction enough to spend money or time on it. Humans usually have prior knowledge about the application domain, which they can use to accept (trust) or reject a prediction if they understand the reasoning behind it. It has been observed, for example, that providing an explanation can increase the acceptance of computer-generated movie recommendations [12] and other automated systems [7].
解释个人预测的过程如图1所示。很明显,如果提供了可理解的解释,医生在模型的帮助下做出决定的能力会更好。在这种情况下,解释是一个带有相对权重的症状的小列表,这些症状要么有助于预测(绿色),要么是反对预测的证据(红色)。在这一点上,以及其他人类借助预测做出决策的例子中,信任是最基本的关注点。即使在风险较低的情况下,比如在产品或电影推荐中,用户也需要足够信任预测,以便在预测上花费金钱或时间。人类通常对应用程序域有先验知识,如果理解其背后的推理,则可以使用这些知识来接受(信任)或拒绝预测。例如,据观察,提供解释可以提高计算机生成的电影推荐[12]和其他自动化系统[7]的接受度。
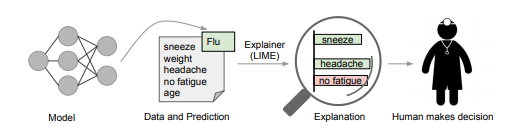
Figure 1: Explaining individual predictions. A model predicts that a patient has the flu, and LIME highlights which symptoms in the patient’s history led to the prediction. Sneeze and headache are portrayed as contributing to the “flu” prediction, while “no fatigue” is evidence against it. With these, a doctor can make an informed decision about the model’s prediction.
图1:解释个别预测。一个模型预测病人患流感,LIME强调了病人病史中哪些症状导致了这种预测。打喷嚏和头痛被认为是“流感”预测的原因之一,而“不疲劳”则是反对这一预测的证据。有了这些,医生就可以对模型的预测做出明智的决定。
Every machine learning application requires a certain measure of trust in the model. Development and evaluation of a classification model often consists of collecting annotated data, followed by learning parameters on a subset and evaluating using automatically computed metrics on the remaining data. Although this is a useful pipeline for many applications, it has become evident that evaluation on validation data often may not correspond to performance “in the wild” due to a number of reasons - and thus trust cannot rely solely on it. Looking at examples is a basic human strategy for comprehension [20], and for deciding if they are trustworthy - especially if the examples are explained. We thus propose explaining several representative individual predictions of a model as a way to provide a global understanding of the model. This global perspective is useful to machine learning practitioners in deciding between different models, or configurations of a model.
每个机器学习应用程序都需要对模型进行一定程度的信任。分类模型的开发和评估通常包括收集带注释的数据,然后学习子集上的参数,并使用自动计算的度量对剩余数据进行评估。尽管这对于许多应用程序来说是一个有用的管道,但很明显,由于许多原因,对验证数据的评估往往不符合“野外”的性能,因此信任不能完全依赖于它。看例子是人类理解的一个基本策略[20],也是判断这些例子是否可信的一个基本策略——特别是如果这些例子被解释了的话。因此,我们建议解释几个有代表性的个人预测模型作为一种方式,提供一个全球性的理解模型。这种全局视角对于机器学习实践者在不同的模型或模型的配置之间做出决定非常有用。
There are several ways a model can go wrong, and practitioners are known to overestimate the accuracy of their models based on cross validation [21]. Data leakage, for example, defined as the unintentional leakage of signal into the training (and validation) data that would not appear in the wild [14], potentially increases accuracy. A challenging example cited by Kaufman et al. [14] is one where the patient ID was found to be heavily correlated with the target class in the training and validation data. This issue would be incredibly challenging to identify just by observing the predictions and the raw data, but much easier if explanations such as the one in Figure 1 are provided, as patient ID would be listed as an explanation for predictions. Another particularly hard to detect problem is dataset shift [5], where training data is different than test data (we give an example in the famous 20 newsgroups dataset later on). The insights given by explanations (if the explanations correspond to what the model is actually doing) are particularly helpful in identifying what must be done to turn an untrustworthy model into a trustworthy one - for example, removing leaked data or changing the training data to avoid dataset shift.
一个模型有几种可能出错的方式,众所周知,实践者基于交叉验证高估了他们模型的准确性[21]。例如,数据泄漏被定义为无意中将信号泄漏到训练(和验证)数据中,而这些数据不会在野外出现[14],这可能会提高准确性。Kaufman等人[14]引用的一个具有挑战性的例子是,在训练和验证数据中,发现患者ID与目标类有着密切的关联。仅仅通过观察预测和原始数据来识别这个问题将是非常具有挑战性的,但是如果提供如图1中所示的解释,会容易得多,因为患者ID将被列为预测的解释。另一个特别难以检测的问题是数据集移位[5],其中训练数据与测试数据不同(稍后我们将在著名的20个新闻组数据集中给出一个示例)。解释给出的见解(如果解释与模型实际执行的操作相对应)特别有助于确定必须做些什么才能将不可信的模型转变为可信的模型—例如,删除泄漏的数据或更改训练数据以避免数据集转移。
Machine learning practitioners often have to select a model from a number of alternatives, requiring them to assess the relative trust between two or more models. In Figure 2, we show how individual prediction explanations can be used to select between models, in conjunction with accuracy. In this case, the algorithm with higher accuracy on the validation set is actually much worse, a fact that is easy to see when explanations are provided (again, due to human prior knowledge), but hard otherwise. Further, there is frequently a mismatch between the metrics that we can compute and optimize (e.g. accuracy) and the actual metrics of interest such as user engagement and retention. While we may not be able to measure such metrics, we have knowledge about how certain model behaviors can influence them. Therefore, a practitioner may wish to choose a less accurate model for content recommendation that does not place high importance in features related to “clickbait” articles (which may hurt user retention), even if exploiting such features increases the accuracy of the model in cross validation. We note that explanations are particularly useful in these (and other) scenarios if a method can produce them for any model, so that a variety of models can be compared.
机器学习实践者通常必须从许多备选方案中选择一个模型,要求他们评估两个或多个模型之间的相对信任。在图2中,我们展示了如何使用单独的预测解释在模型之间进行选择,以及准确性。在这种情况下,在验证集上具有更高精度的算法实际上要糟糕得多,这一事实在提供解释时很容易看到(同样,由于人类的先验知识),但在其他情况下很难看到。此外,我们可以计算和优化的指标(如准确度)与实际的关注指标(如用户参与度和保留率)之间经常不匹配。虽然我们可能无法衡量这些指标,但我们知道某些模型行为会如何影响它们。因此,从业者可能希望为内容推荐选择一个不太准确的模型,该模型不太重视与“clickbait”文章相关的特性(这可能会损害用户保留),即使利用这些特性可以提高交叉验证中模型的准确度。我们注意到,如果一个方法可以为任何模型生成解释,那么解释在这些(和其他)场景中特别有用,这样就可以比较各种模型。
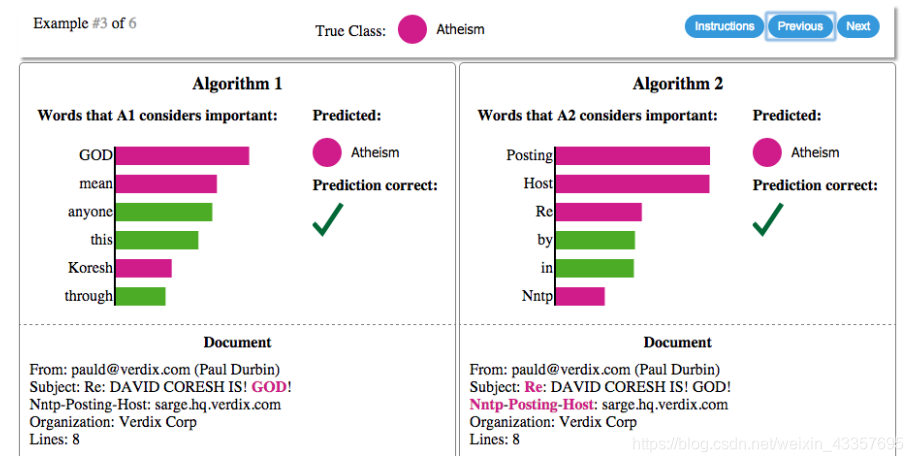
Figure 2: Explaining individual predictions of competing classifiers trying to determine if a document is about “Christianity” or “Atheism”. The bar chart represents the importance given to the most relevant words, also highlighted in the text. Color indicates which class the word contributes to (green for “Christianity”, magenta for “Atheism”). Whole text not shown for space reasons.
图2:解释相互竞争的量词试图确定一个文件是关于“基督教”还是“无神论”的个人预测。条形图表示对最相关单词的重视程度,也在文本中突出显示。颜色表示该词所属的类别(绿色表示“基督教”,洋红色表示“无神论”)。由于篇幅原因,全文未显示。
Desired Characteristics for Explainers 解释者期望的特征
We have argued thus far that explaining individual predictions of classifiers (or regressors) is a significant component for assessing trust in predictions or models. We now outline a number of desired characteristics from explanation methods:
An essential criterion for explanations is that they must be interpretable, i.e., provide qualitative understanding between joint values of input variables and the resulting predicted response value [11]. We note that interpretability must take into account human limitations. Thus, a linear model [24], a gradient vector [2] or an additive model [6] may or may not be interpretable. If hundreds or thousands of features significantly contribute to a prediction, it is not reasonable to expect users to comprehend why the prediction was made, even if they can inspect individual weights. This requirement further implies that explanations should be easy to understand - which is not necessarily true for features used by the model. Thus, the “input variables” in the explanations may be different than the features used by the model.
到目前为止,我们认为解释分类器(或回归器)的个体预测是评估预测或模型可信度的重要组成部分。我们现在从解释方法中概述了一些期望的特征:
解释的一个基本标准是它们必须是可解释的,即在输入变量的联合值和由此产生的预测响应值之间提供定性理解[11]。我们注意到,可解释性必须考虑到人的局限性。因此,线性模型[24]、梯度向量[2]或加法模型[6]可能是可解释的,也可能是不可解释的。如果成百上千的特征对预测有显著贡献,那么期望用户理解预测的原因是不合理的,即使他们可以检查单个权重。这一要求进一步意味着解释应该容易理解——对于模型所使用的特性来说,这并不一定是正确的。因此,解释中的“输入变量”可能与模型使用的特征不同。
Another essential criterion is local fidelity. Although it is often impossible for an explanation to be completely faithful unless it is the complete description of the model itself, for an explanation to be meaningful it must at least be locally faithful - i.e. it must correspond to how the model behaves in the vicinity of the instance being predicted. We note that local fidelity does not imply global fidelity: features that are globally important may not be important in the local context, and vice versa. While global fidelity would imply local fidelity, presenting globally faithful explanations that are interpretable remains a challenge for complex models.
另一个基本标准是局部保真度。尽管解释通常不可能完全忠实,除非它是对模型本身的完整描述,但要使解释有意义,它至少必须是局部忠实的,即它必须与模型在被预测实例附近的行为相对应。我们注意到,局部保真度并不意味着全局保真度:全局重要的特征在局部环境中可能不重要,反之亦然。虽然全局保真度意味着局部保真度,但对于复杂模型来说,提供可解释的全局保真度解释仍然是一个挑战。
While there are models that are inherently interpretable [6, 17, 26, 27], an explainer must be able to explain any model, and thus be model-agnostic (i.e. treating the original model as a black box). Apart from the fact that many state-of-the-art classifiers are not currently interpretable, this also provides flexibility to explain future classifiers.
虽然有些模型本身是可解释的[6,17,26,27],但解释者必须能够解释任何模型,因此是模型不可知论者(即将原始模型视为黑盒)。除了许多最先进的量词目前无法解释外,这也为解释未来的量词提供了灵活性。
In addition to explaining predictions, providing a global perspective is important to ascertain trust in the model. As mentioned before, accuracy may often not be sufficient to evaluate the model, and thus we want to explain the model. Building upon the explanations for individual predictions, we select a few explanations to present to the user, such that they are representative of the model.
除了解释预测之外,提供全球视角对于确定对模型的信任也很重要。如前所述,精度往往不足以评估模型,因此我们要解释模型。在对个别预测的解释的基础上,我们选择了一些解释来呈现给用户,以便它们能够代表模型。
3 Local Interpretable Model-Agnostic Explanations 局部可解释模型不可知解释
We now present Local Interpretable Model-agnostic Explanations (LIME). The overall goal of LIME is to identify an interpretable model over the interpretable representation that is locally faithful to the classifier.
我们现在介绍局部可解释模型不可知解释(LIME)。LIME的总体目标是在局部忠实于分类器的可解释表示上识别一个可解释模型。
3.1 Interpretable Data Representations 可解释数据表示
Before we present the explanation system, it is important to distinguish between features and interpretable data representations. As mentioned before, interpretable explanations need to use a representation that is understandable to humans, regardless of the actual features used by the model. For example, a possible interpretable representation for text classification is a binary vector indicating the presence or absence of a word, even though the classifier may use more complex (and incomprehensible) features such as word embeddings. Likewise for image classification, an interpretable representation may be a binary vector indicating the “presence” or “absence” of a contiguous patch of similar pixels (a super-pixel), while the classifier may represent the image as a tensor with three color channels per pixel. We denote$ x \in \mathbb{R}^d $d be the original representation of an instance being explained, and we use x ′ ∈ { 0 , 1 } d ′ x' \in \{0,1\}^{d'} x′∈{ 0,1}d′ to denote a binary vector for its interpretable representation.
在我们提出解释系统之前,区分特征和可解释数据表示是很重要的。如前所述,可解释的解释需要使用人类可以理解的表示,而不考虑模型使用的实际特征。例如,用于文本分类的可能可解释表示是指示单词的存在或不存在的二进制向量,即使分类器可以使用更复杂(并且不可理解)的特征,例如单词嵌入。同样地,对于图像分类,可解释的表示可以是指示类似像素(超级像素)的连续面片的“存在”或“不存在”的二值向量,而分类器可以将图像表示为每个像素具有三个颜色通道的张量。我们将 x ∈ R d x\in\mathbb{R}^d x∈Rdd表示为被解释实例的原始表示,并使用 x ′ ∈ { 0 , 1 } d ′ x'\in\{0,1\}^{d'} x′∈{ 0,1}d′表示其可解释表示的二进制向量。
3.2 Fidelity-Interpretability Trade-off 保真度可解释性权衡
Formally, we define an explanation as a model g ∈ G g \in G g∈G , where G G G is a class of potentially interpretable models, such as linear models, decision trees, or falling rule lists [27]. The assumption is that given a model g ∈ G g \in G g∈G , we can readily present it to the user with visual or textual artifacts. Note that the domain of g g g is { 0 , 1 } d ′ \{0,1\}^{d'} { 0,1}d′ , i.e. g g g acts over absence/presence of the interpretable components. As noted before, not every g ∈ G g \in G g∈G is simple enough to be interpretable - thus we let Ω ( g ) \Omega(g) Ω(g) be a measure of complexity (as opposed to interpretability) of the explanation g ∈ G g \in G g∈G. For example, for decision trees Ω ( g ) \Omega(g) Ω(g) may be the depth of the tree, while for linear models, Ω ( g ) Ω(g) Ω(g) may be the number of non-zero weights.
形式上,我们将解释定义为模型 g ∈ G g\in G g∈G,其中 g g g是一类潜在的可解释模型,如线性模型、决策树或下降规则列表[27]。假设给定一个模型 g ∈ G g\in G g∈G,我们可以很容易地用视觉或文本工件将其呈现给用户。注意, g g g 的域是 { 0 , 1 } d ′ \{0,1\}^{d'} { 0,1}d′,即, g g g 作用于可解释组件的不存在/存在。如前所述,并不是每个 g ∈ G g\in G g∈G 都简单到可以解释的程度-因此我们让 Ω ( g ) \Omega(g) Ω(g)作为解释 g i n g g\ in g g ing的复杂性(相对于可解释性)的度量。例如,对于决策树, Ω ( g ) \Omega(g) Ω(g)可能是树的深度,而对于线性模型$Ω(g) $可以是非零权重的数目。
Let the model being explained be denoted f : R d → R \mathbb{R}^d \rightarrow R Rd→R. In classification, f ( x ) f(x) f(x) is the probability (or a binary indicator) that x x x belongs to a certain class1. We further use Π x ( z ) \Pi_x(z) Πx(z) as a proximity measure between an instance z z z to x x x, so as to define locality around x x x. Finally, let L ( f , g , Π x ) \mathcal{L}(f, g, \Pi_x) L(f,g,Πx) be a measure of how unfaithful g is in approximating f in the locality defined by Π x \Pi_x Πx. In order to ensure both interpretability and local fidelity, we must minimize L ( f , g , Π x ) \mathcal{L}(f, g, \Pi_x) L(f,g,Πx) while having Ω ( g ) \Omega(g) Ω(g) be low enough to be interpretable by humans. The explanation produced by LIME is obtained by the following:
让被解释的模型用 f f f: R d → R \mathbb{R}^d\rightarrow R Rd→R表示。在分类中, f ( x ) f(x) f(x)是 x x x属于某一类的概率(或二进制指标)。我们进一步使用 Π x ( z ) \Pi_x(z) Πx(z)作为实例 z z z到 x x x之间的邻近度量,以便在 x x x周围定义位置。最后,让 L ( f , g , Π x ) \mathcal{L}(f,g,\Pi_x) L(f,g,Πx)度量g在 Π x \Pi_x Πx定义的局部性中逼近f的不忠程度。为了保证可解释性和局部保真度,我们必须最小化 L ( f , g , Π x ) \mathcal{L}(f,g,\Pi_x) L(f,g,Πx),同时使 Ω ( g ) \Omega(g) Ω(g)足够低,可以被人类解释。由LIME得出的解释如下:
ξ ( x ) = a r g m i n g ∈ G L ( f , g , Π x ) + Ω ( g ) (1) \xi(x) = argmin_{g\in G} \mathcal{L}(f, g, \Pi_x) + \Omega(g)\tag{1} ξ(x)=argming∈GL(f,g,Πx)+Ω(g)(1)
This formulation can be used with different explanation families G G G, fidelity functions L \mathcal{L} L, and complexity measures Ω \Omega Ω. Here we focus on sparse linear models as explanations, and on performing the search using perturbations.
此公式可用于不同的解释族 G G G、保真度函数 L \mathcal{L} L和复杂性度量 Ω \Omega Ω。在这里,我们集中在稀疏线性模型作为解释,并在执行使用扰动搜索。
3.3 Sampling for Local Exploration 局部勘探取样
We want to minimize the expected locally-aware loss L ( f , g , Π x ) \mathcal{L}(f,g,\Pi_x) L(f,g,Πx) without making any assumptions about f, since we want the explainer to be model-agnostic. Thus, in order to learn the local behaviour of f as the interpretable inputs vary, we approximate L ( f , g , Π x ) \mathcal{L}(f,g,\Pi_x) L(f,g,Πx) by drawing samples, weighted by Π x \Pi_x Πx. We sample instances around x ′ x' x′ by drawing nonzero elements of x ′ x' x′ uniformly at random (where the number of such draws is also uniformly sampled). Given a perturbed sample z ′ ∈ { 0 , 1 } d ′ z' \in \{0, 1\}^{d'} z′∈{ 0,1}d′ (which contains a fraction of the nonzero elements of x ′ x' x′ ), we recover the sample in the original representation z ∈ R d z \in \mathbb{R}^d z∈Rd and obtain f ( z ) f(z) f(z), which is used as a label for the explanation model. Given this dataset Z Z Z of perturbed samples with the associated labels, we optimize Eq. (1) to get an explanation ξ ( x ) \xi(x) ξ(x). The primary intuition behind LIME is presented in Figure 3, where we sample instances both in the vicinity of x x x (which have a high weight due to Π x \Pi_x Πx) and far away from x (low weight from Π x \Pi_x Πx). Even though the original model may be too complex to explain globally, LIME presents an explanation that is locally faithful (linear in this case), where the locality is captured by Π x \Pi_x Πx. It is worth noting that our method is fairly robust to sampling noise since the samples are weighted by Π x \Pi_x Πx in Eq. (1). We now present a concrete instance of this general framework.
我们希望最小化预期的局部感知损失 L ( f , g , Π x ) \mathcal{L}(f,g,\Pi_x) L(f,g,Πx),而不需要对f做任何假设,因为我们希望解释者是模型不可知的。因此,为了了解f在可解释输入变化时的局部行为,我们通过绘制样本来近似 L ( f , g , Π x ) \mathcal{L}(f,g,\Pi_x) L(f,g,Πx),加权 Π x \Pi_x Πx。我们通过随机均匀地绘制 x ′ x' x′的非零元素来对 x ′ x' x′周围的实例进行采样(这样绘制的数量也是均匀采样的)。给定一个扰动样本 z ′ ∈ { 0 , 1 } d ′ z'\in\{0,1\}^{d'} z′∈{ 0,1}d′(它包含 x ′ x' x′的一小部分非零元素),我们恢复原始表示形式 z ∈ R d z\in\mathbb{R}^d z∈Rd中的样本并获得 f ( z ) f(z) f(z),它被用作解释模型的标签。给定这个数据集$Z 与 相 关 标 签 的 扰 动 样 本 , 我 们 优 化 E q . ( 1 ) 得 到 解 释 与相关标签的扰动样本,我们优化Eq.(1)得到解释 与相关标签的扰动样本,我们优化Eq.(1)得到解释 \xi(x) 。 L I M E 背 后 的 主 要 直 觉 如 图 3 所 示 , 其 中 我 们 在 。LIME背后的主要直觉如图3所示,其中我们在 。LIME背后的主要直觉如图3所示,其中我们在x 附 近 ( 由 于 附近(由于 附近(由于\Pi_ x 的 权 重 较 高 ) 和 远 离 x ( 从 的权重较高)和远离x(从 的权重较高)和远离x(从\Pi_x 的 权 重 较 低 ) 的 地 方 对 实 例 进 行 了 采 样 。 尽 管 原 始 模 型 可 能 过 于 复 杂 , 无 法 进 行 全 局 解 释 , 但 L I M E 提 供 了 一 种 局 部 忠 实 的 解 释 ( 在 本 例 中 是 线 性 的 ) , 其 中 局 部 由 的权重较低)的地方对实例进行了采样。尽管原始模型可能过于复杂,无法进行全局解释,但LIME提供了一种局部忠实的解释(在本例中是线性的),其中局部由 的权重较低)的地方对实例进行了采样。尽管原始模型可能过于复杂,无法进行全局解释,但LIME提供了一种局部忠实的解释(在本例中是线性的),其中局部由\Pi_ x 捕 获 。 值 得 注 意 的 是 , 我 们 的 方 法 对 采 样 噪 声 相 当 稳 健 , 因 为 在 公 式 ( 1 ) 中 , 样 本 的 权 重 是 捕获。值得注意的是,我们的方法对采样噪声相当稳健,因为在公式(1)中,样本的权重是 捕获。值得注意的是,我们的方法对采样噪声相当稳健,因为在公式(1)中,样本的权重是\Pi_ x$。我们现在提出这一总体框架的一个具体实例。
3.4 Sparse Linear Explanations 稀疏线性解释
For the rest of this paper, we let G G G be the class of linear models, such that g ( z ′ ) = w g ⋅ z ′ g(z') = w_g \cdot z' g(z′)=wg⋅z′ . We use the locally weighted square loss as L \mathcal{L} L, as defined in Eq. (2), where we let Π x ( z ) = e x p ( − D ( x , z ) 2 / σ 2 ) \Pi_x(z) = exp(−D(x, z)^2/σ^2 ) Πx(z)=exp(−D(x,z)2/σ2) be an exponential kernel defined on some distance function D D D (e.g. cosine distance for text, L 2 L2 L2 distance for images) with width σ σ σ.
在本文的其余部分,我们假设 G G G是一类线性模型,使得 G ( z ′ ) = w g ⋅ z ′ G(z')=w_g \cdot z' G(z′)=wg⋅z′。我们使用局部加权平方损失作为 L \mathcal{L} L,如等式(2)中所定义,其中我们让 Π x ( z ) = e x p ( − D ( x , z ) 2 / σ 2 ) \Pi_x(z)=exp(−D(x,z)^2/σ^2) Πx(z)=exp(−D(x,z)2/σ2)是在某个距离函数 D D D(例如,文本的余弦距离, L 2 L2 L2图像的距离)上定义的具有宽度的指数核 σ σ σ.
L ( f , g , Π x ) = ∑ z , z ′ ∈ Z ( f ( z ) − g ( z ′ ) ) 2 (2) \mathcal{L}(f,g,\Pi_x)=\sum_{z,z'\in Z}(f(z)-g(z'))^2\tag{2} L(f,g,Πx)=z,z′∈Z∑(f(z)−g(z′))2(2)
For text classification, we ensure that the explanation is interpretable by letting the interpretable representation be a bag of words, and by setting a limit K on the number of words included, i.e. Ω ( g ) = ∞ I [ ∥ w g ∥ 0 > K ] \Omega(g) = \infty \mathbb{I}[\|{w_g}\|_0 > K] Ω(g)=∞I[∥wg∥0>K]. We use the same Ω \Omega Ω for image classification, using “super-pixels” (computed using any standard algorithm) instead of words, such that the interpretable representation of an image is a binary vector where 1 indicates the original super-pixel and 0 indicates a grayed out super-pixel. This particular choice of Ω \Omega Ω makes directly solving Eq. (1) intractable, but we approximate it by first selecting K K K features with Lasso (using the regularization path [8]) and then learning the weights via least squares (a procedure we call K-LASSO in Algorithm 1). We note that in Algorithm 1, the time required to produce an explanation is dominated by the complexity of the black box model f ( z i ) f(zi) f(zi). To give a rough idea of running time, explaining predictions from random forests with 1000 trees using scikit-learn2 on a laptop with N = 5000 takes around 3 seconds. Explaining each prediction of the Inception network [25] for image classification takes around 10 minute
对于文本分类,我们通过让可解释的表示为一个单词包,并通过对包含的单词数设置一个限制 K K K,即 Ω ( g ) = ∞ i [ ∥ w ∣ g ∥ u 0 > K ] \Omega(g)=\infty\mathbb{i}[\|{w|g}\|u 0>K] Ω(g)=∞i[∥w∣g∥u0>K],来确保解释是可解释的。我们使用相同的 Ω \Omega Ω进行图像分类,使用“超级像素”(使用任何标准算法计算)而不是单词,这样图像的可解释表示是一个二进制向量,其中1表示原始超级像素,0表示灰显超级像素。这种特殊的 Ω \Omega Ω选择使得直接求解公式(1)变得困难,但是我们首先用套索选择 K K K特征(使用正则化路径[8]),然后通过最小二乘法学习权重(在算法1中我们称之为K-Lasso)。我们注意到,在算法1中,产生解释所需的时间主要取决于黑箱模型 f ( z i ) f(zi) f(zi)的复杂性。要大致了解运行时间,在N=5000的笔记本电脑上使用scikit-learn2解释来自1000棵树的随机森林的预测大约需要3秒钟。解释用于图像分类的初始网络[25]的每个预测大约需要10分钟
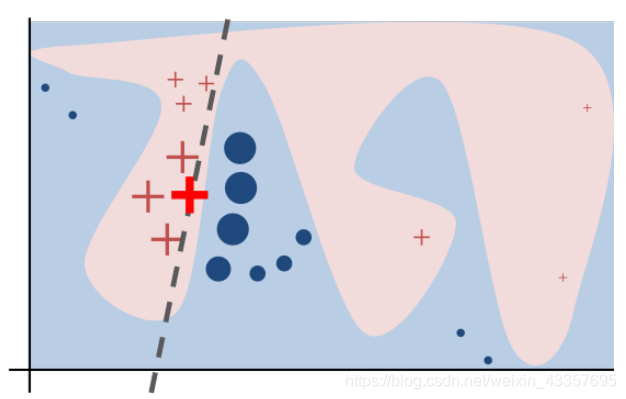
Figure 3: Toy example to present intuition for LIME. The black-box model’s complex decision function f (unknown to LIME) is represented by the blue/pink background, which cannot be approximated well by a linear model. The bright bold red cross is the instance being explained. LIME samples instances, gets predictions using f, and weighs them by the proximity to the instance being explained (represented here by size). The dashed line is the learned explanation that is locally (but not globally) faithful.
图3:展示LIME直觉的玩具示例。黑盒模型的复杂决策函数f(LIME未知)用蓝色/粉色背景表示,不能用线性模型很好地逼近。明亮粗体的红十字会就是被解释的例子。LIME对实例进行采样,使用f获取预测,并根据与被解释实例的接近程度对它们进行加权(这里用大小表示)。虚线是局部(但不是全局)忠实的所学解释。
| Algorithm 1 LIME for Sparse Linear Explanations |
|---|
| Require: Classifier f, Number of samples N Require: Instance x, and its interpretable version x 0 **Require: **Similarity kernel Π x \Pi_x Πx, Length of explanation K $Z \leftarrow {} $ for i ∈ 1 , 2 , 3 , . . . , N i \in {1, 2, 3, ..., N} i∈1,2,3,...,N do z ’ i ← s a m p l e a r o u n d ( x ′ ) z ’_ i ← sample_around(x ' ) z’i←samplearound(x′) Z ← Z ⋃ [ z i ′ , f ( z i ) , Π x ( z i ) Z \leftarrow Z \bigcup [z'_i , f(z_i), \Pi_x\left(zi\right) Z←Z⋃[zi′,f(zi),Πx(zi) end for w ← w \leftarrow w← K-Lasso ( Z , K ) (Z, K) (Z,K) with z i ′ z'_i zi′ as features, f ( z ) f(z) f(z) as target return w |
3.5 Example 1: Text classification with SVM 支持向量机在文本分类中的应用
In Figure 2 (right side), we explain the predictions of a support vector machine with RBF kernel trained on unigrams to differentiate “Christianity” from “Atheism” (on a subset of the 20 newsgroup dataset). Although this classifier achieves 94% held-out accuracy, and one would be tempted to trust it based on this, the explanation for an instance shows that predictions are made for quite arbitrary reasons (words “Posting”, “Host” and “Re” have no connection to either Christianity or Atheism). The word “Posting” appears in 22% of examples in the training set, 99% of them in the class “Atheism”. Even if headers are removed, proper names of prolific posters (such as “Keith”) in the original newsgroups are selected by the classifier, which would also not generalize.
在图2中(右侧),我们解释了支持向量机的预测,支持向量机的RBF核在单字图上训练,以区分“基督教”和“无神论”(在20个新闻组数据集的子集上)。尽管这个分类器达到了94%的准确率,人们可能会因此而相信它,但对一个实例的解释表明,预测是出于相当武断的原因(单词“Posting”、“Host”和“Re”与基督教或无神论都没有联系)。“发帖”一词出现在22%的训练样本中,99%出现在“无神论”课上。即使删除标题,分类器也会选择原始新闻组中多产海报(如“基思”)的专有名称,这也不会泛化。
After getting such insights from explanations, it is clear that this dataset has serious issues (which are not evident just by studying the raw data or predictions), and that this classifier, or held-out evaluation, cannot be trusted. It is also clear what the problems are, and the steps that can be taken to fix these issues and train a more trustworthy classifier.
在从解释中获得这样的见解之后,很明显,这个数据集有严重的问题(仅仅通过研究原始数据或预测是不明显的),并且这个分类器,或者说坚持评估,是不可信的。我们也很清楚问题是什么,以及可以采取哪些步骤来解决这些问题,并培训一个更值得信赖的分类器。

Figure 4: Explaining an image classification prediction made by Google’s Inception network, highlighting positive pixels. The top 3 classes predicted are “Electric Guitar” (p = 0.32), “Acoustic guitar” (p = 0.24) and “Labrador” (p = 0.21)
图4:解释谷歌的Inception网络所做的图像分类预测,突出显示正像素。预测的前三名是“电吉他”(p=0.32)、“原声吉他”(p=0.24)和“拉布拉多”(p=0.21)
3.6 Example 2: Deep networks for images 图像深度网络
We learn a linear model with positive and negative weights for each super-pixel in an image. For the purpose of visualization, one may wish to just highlight the super-pixels with positive weight towards a specific class, as they give intuition as to why the model would think that class may be present. We explain the prediction of Google’s pre-trained Inception neural network [25] in this fashion on an arbitrary image (Figure 4a). Figures 4b, 4c, 4d show the super-pixels explanations for the top 3 predicted classes (with the rest of the image grayed out), having set K = 10. What the neural network picks up on for each of the classes is quite natural to humans - Figure 4b in particular provides insight as to why acoustic guitar was predicted to be electric: due to the fretboard. This kind of explanation enhances trust in the classifier (even if the top predicted class is wrong), as it shows that it is not acting in an unreasonable manner.
我们学习一个线性模型,在图像中每个超级像素都有正负权重。为了可视化的目的,人们可能希望只突出显示特定类的正权重的超级像素,因为它们给出了模型为什么会认为该类可能存在的直觉。我们以这种方式解释了谷歌预先训练的初始神经网络[25]对任意图像的预测(图4a)。图4b、4c、4d显示了前3个预测类的超像素解释(其余图像变灰),设置K=10后,神经网络对每一类的学习对人类来说都是很自然的-图4b特别提供了关于原声吉他为什么会被预测为电吉他的见解:这是由于fretboard。这种解释增强了对分类器的信任(即使最前面预测的类是错误的),因为它表明它没有以不合理的方式行事。
4 Submodular Pick for Explaining Models 用于解释模型的子模块选取
Although an explanation of a single prediction provides some understanding into the reliability of the classifier to the user, it is not sufficient to evaluate and assess trust in the model as a whole. We propose to give a global understanding of the model by explaining a set of individual instances. This approach is still model agnostic, and is complementary to computing summary statistics such as held-out accuracy.
尽管对单个预测的解释为用户提供了对分类器可靠性的一些理解,但仅从整体上评估和评估模型中的信任是不够的。我们建议通过解释一组单独的实例来给出对模型的全局理解。这种方法仍然是模型不可知的,并且是对计算摘要统计信息(如保持准确度)的补充。
Even though explanations of multiple instances can be insightful, these instances need to be selected judiciously, since users may not have the time to ex- amine a large number of explanations. We represent the time and patience that humans have by a budget B that denotes the number of explanations they are willing to look at in order to understand a model. Given a set of instances X, we define the pick step as the task of selecting B instances for the user to inspect.
尽管对多个实例的解释可能很有见地,但这些实例需要谨慎选择,因为用户可能没有时间解释大量的解释。我们用预算B来表示人类拥有的时间和耐心,预算B表示为了理解一个模型他们愿意看的解释的数量。给定一组实例X,我们将pick步骤定义为选择B个实例供用户检查的任务。
The pick step is not dependent on the existence of explanations - one of the main purpose of tools like Modeltracker [1] and others [10] is to assist users in selecting instances themselves, and examining the raw data and predictions. However, as we have argued that looking at raw data is not enough to understand predictions and get insights, it is intuitive that a method for the pick step should take into account the explanations that accompany each prediction. Moreover, this method should pick a diverse, representative set of explanations to show the user – i.e. non-redundant explanations that represent how the model behaves globally.
选择步骤并不依赖于解释的存在—Modeltracker[1]和其他[10]等工具的主要目的之一是帮助用户自己选择实例,并检查原始数据和预测。然而,正如我们所争论的那样,查看原始数据不足以理解预测和获得见解,因此选择步骤的方法应该考虑每个预测附带的解释,这是很直观的。此外,这种方法应该选择一组不同的、有代表性的解释来向用户展示,即非冗余的解释来表示模型的全局行为。
Given all of the explanations for a set of instances X X X, we construct an n × d ′ n \times d' n×d′ explanation matrix W W W that represents the local importance of the interpretable components for each instance. When using linear models as explanations, for an instance xi and explanation g i = ξ ( x i ) g_i = \xi(x_i) gi=ξ(xi), we set W i j = ∣ w g i j ∣ W_{ij} = |w_{g_{ij} }| Wij=∣wgij∣. Further, for each component j in W, we let I j I_j Ij denote the global importance, or representativeness of that component in the explanation space. Intuitively, we want I such that features that explain many different instances have higher importance scores. Concretely for the text applications, we set I j = ∑ i = 1 n W i j I_j = \sqrt{\sum^n_{i=1}{W_{ij}}} Ij=∑i=1nWij . For images, I I I must measure something that is comparable across the super-pixels in different images, such as color histograms or other features of super-pixels; we leave further exploration of these ideas for future work. In Figure 5, we show a toy example W, with n = d ′ = 5 n = d'= 5 n=d′=5, where W is binary (for simplicity). The importance function I should score feature f2 higher than feature f1, i.e. I 2 > I 1 I_2 > I_1 I2>I1, since feature f2 is used to explain more instances.
给定一组实例 X X X的所有解释,我们构造了一个 n × d ′ n\times d' n×d′解释矩阵 W W W,它表示每个实例的可解释组件的局部重要性。当使用线性模型作为解释时,对于实例席席和解释 g i = ξ ( X i ) g_i= \xi(X_i) gi=ξ(Xi),我们设置 W i j = ∣ W g i j ∣ W_{ij}=|W_{g_{ij}}| Wij=∣Wgij∣。此外,对于W中的每个分量j,我们让 I j I_j Ij表示该分量在解释空间中的全局重要性或代表性。直觉上,我们希望我这样的特点,解释许多不同的例子有较高的重要性得分。具体地说,对于文本应用程序,我们设置 I j = ∑ i = 1 n W i j I_j=\sqrt{\sum^n_{i=1}W_{ij}} Ij=∑i=1nWij。对于图像, I I I必须测量不同图像中的超级像素之间的可比性,例如颜色直方图或超级像素的其他特征;我们将这些想法留给今后的工作进一步探讨。在图5中,我们展示了一个玩具示例W, n = d ′ = 5 n=d'=5 n=d′=5,其中W是二进制的(为了简单起见)。重要性函数I应将特征f2的得分高于特征f1,即 I 2 > I 1 I_2>I_1 I2>I1,因为特征f2用于解释更多实例。
| Algorithm 2 Submodular pick algorithm |
|---|
| Require: Instances X, Budget B for all x i ∈ X x_i \in X xi∈X do W i ← W_ i \leftarrow Wi← explain ( x i , x i ′ ) (x_i,x'_i) (xi,xi′) Using Algorithm 1 end for for j ∈ { 0... d ′ } j \in \{0...d'\} j∈{ 0...d′} do $I_j \leftarrow \sqrt{\sum^n_{i=1} |
While we want to pick instances that cover the important components, the set of explanations must not be redundant in the components they show the users, i.e. avoid selecting instances with similar explanations. In Figure 5, after the second row is picked, the third row adds no value, as the user has already seen features f2 and f3 - while the last row exposes the user to completely new features. Selecting the second and last row results in the coverage of almost all the features. We formalize this non-redundant coverage intuition in Eq. (3), where we define coverage as the set function c, given W and I, which computes the total importance of the features that appear in at least one instance in a set V .
c ( V , W , I ) = ∑ j = 1 d ′ I [ ∃ i ∈ V : W i j > 0 ] I j (3) c(V, W, I) =\sum^{d'}_{j=1}\mathbb{I}_{[\exists i \in V:W_{ij}>0]}I_j\tag{3} c(V,W,I)=j=1∑d′I[∃i∈V:Wij>0]Ij(3)
虽然我们希望选择涵盖重要组件的实例,但在向用户显示的组件中,解释集不能是冗余的,即避免选择具有类似解释的实例。在图5中,在选取第二行之后,第三行没有添加任何值,因为用户已经看到了功能f2和f3—而最后一行向用户展示了全新的功能。选择第二行和最后一行可以覆盖几乎所有的特性。我们在式(3)中形式化了这种非冗余覆盖直觉,其中我们将覆盖定义为给定W和I的集合函数c,它计算在集合V中至少一个实例中出现的特征的总重要性。
The pick problem is defined in Eq. (4), and it consists of finding the set V, |V | ≤ B that achieves highest coverage.
pick问题在式(4)中定义,它包括寻找集合V,| V |≤ B达到最高覆盖率。
P i c k ( W , I ) = arg max V , ∣ V ∣ ≤ B c ( V , W , I ) (4) Pick\left(W,I\right)= {\mathop{\arg\max}}_{V,|V|\leq B^{c(V,W,I)}}\tag{4} Pick(W,I)=argmaxV,∣V∣≤Bc(V,W,I)(4)
The problem in Eq. (4) is maximizing a weighted coverage function, and is NP-hard [9]. Let c ( V ⋃ { i } , W , I ) − c ( V , W , I ) c(V \bigcup \{i\}, W, I) − c(V, W, I) c(V⋃{
i},W,I)−c(V,W,I) be the marginal coverage gain of adding an instance i to a set V . Due to sub-modularity, a greedy algorithm that iteratively adds the instance with the highest marginal coverage gain to the solution offers a constant-factor approximation guarantee of 1−1/e to the optimum [15]. We outline this approximation for the pick step in Algorithm 2, and call it submodular pick.
式(4)中的问题是最大化加权覆盖函数,是NP-hard的[9]。让 c ( V ⋃ { i } , W , i ) − c ( V , W , I ) c(V\bigcup\{i\},W,i)− c(V,W,I) c(V⋃{ i},W,i)−c(V,W,I)是将实例I添加到集合V的边际覆盖增益。由于子模块化,贪婪算法迭代地将具有最高边缘覆盖增益的实例添加到解中,从而提供了1的常数因子近似保证−1/e至最佳值[15]。我们概述了算法2中选取步骤的这种近似,并称之为子模选取。
5 Simulated User Experiments 模拟用户实验
In this section, we present simulated user experiments to evaluate the usefulness of explanations in trust-related tasks. In particular, we address the following questions: (1) Are the explanations faithful to the model, (2) Can the explanations aid users in ascertaining trust in predictions, and (3) Are the explanations useful for evaluating the model as a whole.
在本节中,我们将通过模拟用户实验来评估解释在信任相关任务中的有用性。特别地,我们讨论了以下问题:(1)解释是否忠实于模型,(2)解释是否有助于用户确定预测的可信度,以及(3)解释是否有助于评估整个模型。
5.1 Experiment Setup 实验设置
We use two sentiment analysis datasets (books and DVDs, 2000 instances each) where the task is to classify product reviews as positive or negative [4]. The results on two other datasets (electronics, and kitchen) are similar, thus we omit them due to space. We train decision trees (DT), logistic regression with L2 regularization (LR), nearest neighbors (NN), and support vector machines with RBF kernel (SVM), all using bag of words as features. We also include random forests (with 1000 trees) trained with the average word2vec embedding [19] (RF), a model that is impossible to interpret. We use the implementations and default parameters of scikit-learn, unless noted otherwise. We divide each dataset into train (1600 instances) and test (400 instances). Code for replicating our experiments is available online .
我们使用两个情绪分析数据集(书籍和DVD,每个2000个实例),其中的任务是将产品评论分为正面或负面[4]。另外两个数据集(电子设备和厨房)的结果是相似的,因此由于空间的原因,我们省略了它们。我们训练决策树(DT)、L2正则化logistic回归(LR)、最近邻(NN)和RBF核支持向量机(SVM),都是以词包作为特征。我们还包括用平均word2vec嵌入[19](RF)训练的随机森林(有1000棵树),这是一个无法解释的模型。我们使用scikit learn的实现和默认参数,除非另有说明。我们将每个数据集分为train(1600个实例)和test(400个实例)。复制我们实验的代码可以在网上找到 https://github.com/marcotcr/lime-experiments。
To explain individual predictions, we compare our proposed approach (LIME), with parzen [2], for which we take the K features with the highest absolute gradients as explanations. We set the hyperparameters for parzen and LIME using cross validation, and set N = 15, 000. We also compare against a greedy procedure (similar to Martens and Provost [18]) in which we greedily remove features that contribute the most to the predicted class until the prediction changes (or we reach the maximum of K features), and a random procedure that randomly picks K features as an explanation. We set K to 10 for our experiments. For experiments where the pick procedure applies, we either do random selection (random pick, RP) or the procedure described in Section 4 (submodular pick, SP). We refer to pick-explainer combinations by adding RP or SP as a prefix.
为了解释个别预测,我们将我们提出的方法(LIME)与parzen[2]进行了比较,parzen[2]将具有最高绝对梯度的K特征作为解释。我们使用交叉验证设置parzen和LIME的超参数,并设置N=15000。我们还与贪婪程序(类似于Martens和Provost[18])进行比较,在贪婪程序中,我们贪婪地删除对预测类贡献最大的特征,直到预测发生变化(或达到K个特征的最大值),随机选取K个特征作为解释。我们的实验把K设为10。对于选取程序适用的实验,我们要么进行随机选择(random pick,RP),要么进行第4节中描述的程序(submodular pick,SP)。我们通过添加RP或SP作为前缀来引用pick解释者组合。
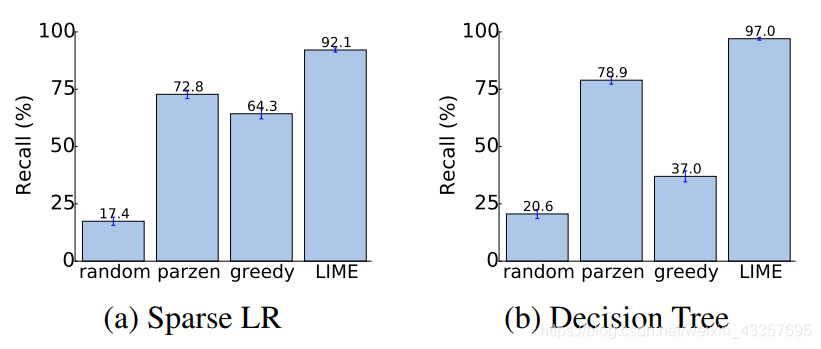
Figure 6: Recall on truly important features for two interpretable classifiers on the books dataset.
图6:books数据集上两个可解释分类器的真正重要特性的召回率。

Figure 7: Recall on truly important features for two interpretable classifiers on the DVDs dataset.
图7:DVD数据集上两个可解释分类器的真正重要特性召回率。
5.2 Are explanations faithful to the model? 解释是否忠实于模型?
We measure faithfulness of explanations on classifiers that are by themselves interpretable (sparse logistic regression and decision trees). In particular, we train both classifiers such that the maximum number of features they use for any instance is 10. For such models, we know the set of truly important features. For each prediction on the test set, we generate explanations and compute the fraction of truly important features that are recovered by the explanations. We report this recall averaged over all the test instances in Figures 6 and 7. We observe that the greedy approach is comparable to parzen on logistic regression, but is substantially worse on decision trees since changing a single feature at a time often does not have an effect on the prediction. However, text is a particularly hard case for the parzen explainer, due to the difficulty in approximating the original classifier in high dimensions, thus the overall recall by parzen is low. LIME consistently provides > 90% recall for both logistic regression and decision trees on both datasets, demonstrating that LIME explanations are quite faithful to the model.
我们测量信度的解释分类器本身是可解释的(稀疏逻辑回归和决策树)。特别是,我们训练这两个分类器,使它们在任何情况下使用的最大特征数为10。对于这样的模型,我们知道真正重要的特征集。对于测试集上的每个预测,我们生成解释,并计算由解释恢复的真正重要特征的分数。我们在图6和图7中报告了所有测试实例的平均召回率。我们观察到贪婪方法在逻辑回归上与parzen方法相当,但在决策树上却差得多,因为每次改变一个特征通常不会对预测产生影响。然而,对于parzen解释者来说,文本是一个特别困难的例子,因为在高维上很难逼近原始分类器,因此parzen的整体召回率很低。在这两个数据集上,LIME始终为logistic回归和决策树提供>90%的召回率,这表明LIME的解释对模型非常忠实。
5.3 Should I trust this prediction? 我应该相信这个预测吗?
In order to simulate trust in individual predictions, we first randomly select 25% of the features to be “untrustworthy”, and assume that the users can iden-tify and would not want to trust these features (such as the headers in 20 newsgroups, leaked data, etc). We thus develop oracle “trustworthiness” by labeling test set predictions from a black box classifier as “untrustworthy” if the prediction changes when untrustworthy features are removed from the instance, and “trustworthy” otherwise. In order to simulate users, we assume that users deem predictions untrustworthy from LIME and parzen explanations if the prediction from the linear approximation changes when all untrustworthy features that appear in the explanations are removed (the simulated human “discounts” the effect of untrustworthy features). For greedy and random, the prediction is mistrusted if any untrustworthy features are present in the explanation, since these methods do not provide a notion of the contribution of each feature to the prediction. Thus for each test set prediction, we can evaluate whether the simulated user trusts it using each explanation method, and compare it to the trustworthiness oracle.
为了模拟对个人预测的信任,我们首先随机选择25%的特征为“不可信”,并假设用户能够识别并且不想信任这些特征(例如20个新闻组中的标题、泄露的数据等)。因此,如果从实例中删除不可信的特征时,预测发生变化,则将来自黑盒分类器的测试集预测标记为“不可信”,否则标记为“可信”,从而开发oracle“可信”。为了模拟用户,我们假设当删除解释中出现的所有不可信特征时,如果线性近似的预测发生变化(模拟的人类“折扣”了不可信特征的影响),用户认为来自LIME和parzen解释的预测是不可信的。对于贪婪和随机,如果解释中存在任何不可信的特征,则预测是不可信的,因为这些方法没有提供每个特征对预测的贡献的概念。因此,对于每一个测试集预测,我们可以使用每一种解释方法来评估模拟用户是否信任它,并将其与可信预言机进行比较。
Using this setup, we report the F1 on the trustworthy predictions for each explanation method, averaged over 100 runs, in Table 1. The results indicate that LIME dominates others (all results are significant at p = 0.01) on both datasets, and for all of the black box models. The other methods either achieve a lower recall (i.e. they mistrust predictions more than they should) or lower precision (i.e. they trust too many predictions), while LIME maintains both high precision and high recall. Even though we artificially select which features are untrustworthy, these results indicate that LIME is helpful in assessing trust in individual predictions.
5.4 Can I trust this model? 我能相信这个模型吗?
In the final simulated user experiment, we evaluate whether the explanations can be used for model selection, simulating the case where a human has to decide between two competing models with similar accuracy on validation data. For this purpose, we add 10 artificially “noisy” features. Specifically, on training and validation sets (80/20 split of the original training data), each artificial feature appears in 10% of the examples in one class, and 20% of the other, while on the test instances, each artificial feature appears in 10% of the examples in each class. This recreates the situation where the models use not only features that are informative in the real world, but also ones that are noisy and introduce spurious correlations. We create pairs of competing classifiers by repeatedly training pairs of random forests with 30 trees until their validation accuracy is within 0.1% of each other, but their test accuracy differs by at least 5%. Thus, it is not possible to identify the better classifier (the one with higher test accuracy) from the accuracy on the validation data.
在最后的模拟用户实验中,我们评估了这些解释是否可以用于模型选择,模拟了一个人在验证数据上必须在两个具有相似精度的竞争模型之间做出决定的情况。为此,我们添加了10个人工“噪声”特征。具体来说,在训练集和验证集(原始训练数据的80/20分割)上,每个人工特征出现在一个类中10%的示例中,另一个类中20%的示例中,而在测试实例上,每个人工特征出现在每个类中10%的示例中。这再现了这样一种情况:模型不仅使用了在现实世界中提供信息的特征,而且还使用了噪声和引入虚假相关性的特征。我们通过重复训练30棵树的随机林对来创建竞争分类器对,直到它们的验证精度在彼此的0.1%以内,但是它们的测试精度至少相差5%。因此,不可能从验证数据的精度中识别出更好的分类器(具有更高测试精度的分类器)。
The goal of this experiment is to evaluate whether a user can identify the better classifier based on the explanations of B instances from the validation set. The simulated human marks the set of artificial features that appear in the B explanations as untrustworthy, following which we evaluate how many total predictions in the validation set should be trusted (as in the previous section, treating only marked features as untrustworthy). Then, we select the classifier with fewer untrustworthy predictions, and compare this choice to the classifier with higher held-out test set accuracy.
本实验的目的是评估用户是否能够根据验证集中的B个实例的解释来识别更好的分类器。模拟人将出现在B解释中的一组人工特征标记为不可信,然后我们评估验证集中有多少预测应该可信(如前一节所述,仅将标记的特征视为不可信)。然后,我们选择不可信预测较少的分类器,并将其与保持测试集精度较高的分类器进行比较。
Table 1: Average F1 of trustworthiness for different explainers on a collection of classifiers and datasets.
表1:不同解释者在分类器和数据集上的可信度的平均F1。
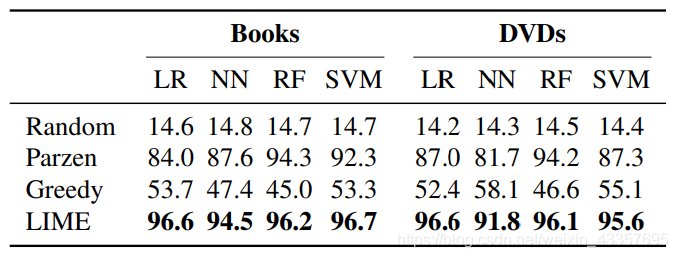
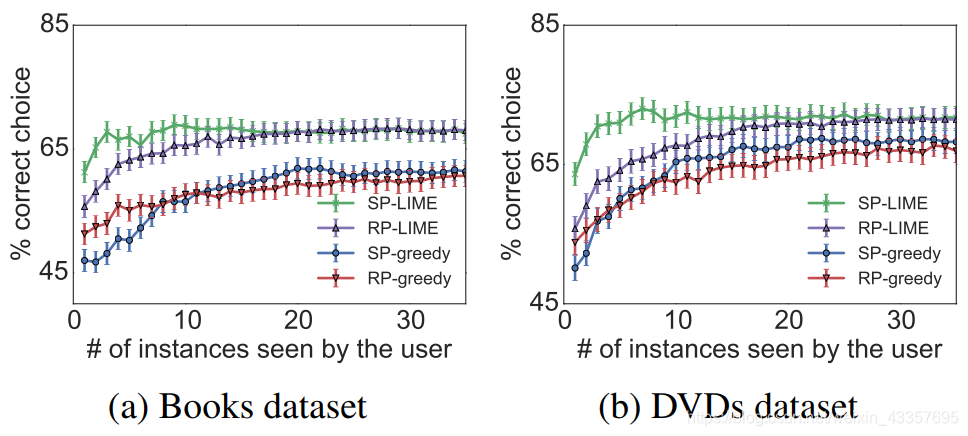
Figure 8: Choosing between two classifiers, as the number of instances shown to a simulated user is varied. Averages and standard errors from 800 runs.
图8:在两个分类器之间进行选择,因为显示给模拟用户的实例数量是不同的。800次的平均值和标准误差。
We present the accuracy of picking the correct classifier as B varies, averaged over 800 runs, in Figure 8. We omit SP-parzen and RP-parzen from the figure since they did not produce useful explanations for this task, performing only slightly better than random. We see that LIME is consistently better than greedy, irrespective of the pick method. Further, combining submodular pick with LIME outperforms all other methods, in particularly it is much better than using RP-LIME when only a few examples are shown to the users. These results demonstrate that the trust assessments provided by SP-selected LIME explanations are good indicators of generalization, which we validate with human experiments in the next section.
在图8中,我们给出了选择正确分类器的准确度,因为B变化,平均超过800次。我们从图中省略了SP parzen和RP parzen,因为它们没有对这项任务产生有用的解释,只比random的性能稍好。我们看到,无论采用哪种方法,LIME始终优于greedy。此外,将子模pick与LIME相结合的方法优于其他所有方法,特别是当只向用户展示几个示例时,它比使用RP-LIME要好得多。这些结果表明,SP-selected-LIME解释提供的信任评估是一个很好的泛化指标,我们将在下一节通过人体实验验证这一点。
6 Evaluation with Human Subjects 人体评价
In this section, we recreate three scenarios in machine learning that require trust and understanding of predictions and models. In particular, we evaluate LIME and SP-LIME in the following settings: (1) Can users choose from two classifiers the one that generalizes better (Section 6.2), (2) based on the explanations, can users perform feature engineering to improve the model (Section 6.3), and (3) are users able to identify and describe classifier irregularities by looking at explanations (Section 6.4).
在本节中,我们将重新创建机器学习中需要信任和理解预测和模型的三个场景。特别是,我们在以下设置中评估了LIME和SP-LIME:(1)用户可以从两个分类器中选择一个更通用的分类器(第6.2节),(2)根据解释,用户可以执行特征工程来改进模型(第6.3节),(3)用户是否能够通过查看解释来识别和描述分类器的不规则性(第6.4节)。
6.1 Experimental setup 实验设置
For experiments in sections 6.2 and 6.3, we use the subset of 20 newsgroups mentioned beforehand, where the task is to distinguish between “Christianity” and “Atheism” documents. This dataset is quite problematic since it contains features that do not generalize well (e.g. very informative header information and author names), and thus validation accuracy considerably overestimates real-world performance.
对于第6.2节和第6.3节中的实验,我们使用前面提到的20个新闻组的子集,其中的任务是区分“基督教”和“无神论”文档。这个数据集是相当有问题的,因为它包含的特性不能很好地概括(例如,非常信息丰富的标题信息和作者姓名),因此验证的准确性大大高估了真实世界的性能。
In order to estimate the real world performance, we create a new religion dataset for evaluation. We download Atheism and Christianity websites from the DMOZ directory4 and human curated lists, yielding 819 webpages in each class (more details and data available online5 ). High accuracy on the religion dataset by a classifier trained on 20 newsgroups indicates that the classifier is generalizing using semantic content, instead of placing importance on the data specific issues outlined above.
为了估计真实世界的性能,我们创建了一个新的宗教数据集进行评估。我们从DMOZ目录下载无神论和基督教网站4和人类策展名单,每节课产生819个网页(更多详情和数据可在线获取)。在20个新闻组中训练的分类器对宗教数据集的高精度表明,分类器是使用语义内容进行概括,而不是重视上述数据特定的问题。
Unless noted otherwise, we use SVM with RBF kernel, trained on the 20 newsgroups data with hyperparameters tuned via the cross-validation. This classifier obtains 94% accuracy on the original 20 newsgroups train-test split.
除非另有说明,我们使用带RBF核的SVM,对20个新闻组数据进行训练,通过交叉验证调整超参数。该分类器在原来的20个新闻组序列测试分割上获得了94%的准确率。
6.2 Can users select the best classifier? 用户能选择最好的分类器吗?
In this section, we want to evaluate whether explanations can help users decide which classifier generalizes better - that is, which classifier the user trusts more “in the wild”. Specifically, users have to decide between two classifiers: SVM trained on the original 20 newsgroups dataset, and a version of the same classifier trained on a “cleaned” dataset where many of the features that do not generalize are manually removed using regular expressions. The original classifier achieves an accuracy score of 57.3% on the religion dataset, while the “cleaned” classifier achieves a score of 69.0%. In contrast, the test accuracy on the original train/test split for 20 newsgroups is 94.00% and 88.6%, respectively - suggesting that the worse classifier would be selected if accuracy alone is used as a measure of trust.
在本节中,我们要评估解释是否可以帮助用户决定哪个分类器概括得更好—也就是说,用户“在野外”更信任哪个分类器。具体来说,用户必须在两个分类器之间做出选择:一个是在原来的20个新闻组数据集上训练的SVM,另一个是在一个“干净”的数据集上训练的同一个分类器的一个版本,其中许多没有泛化的特征是使用正则表达式手动删除的。原始分类器在宗教数据集上的准确率为57.3%,而“干净”分类器的准确率为69.0%。相比之下,20个新闻组的原始序列/测试分割的测试准确率分别为94.00%和88.6%——这表明,如果仅以准确率作为信任的衡量标准,则会选择更差的分类器。
We recruit human subjects on Amazon Mechanical Turk – by no means machine learning experts, but instead people with basic knowledge about religion. We measure their ability to choose the better algorithm by seeing side-by-side explanations with the associated raw data (as shown in Figure 2). We restrict both the number of words in each explanation (K) and the number of documents that each person inspects (B) to 6. The position of each algorithm and the order of the instances seen are randomized between subjects. After examining the explanations, users are asked to select which algorithm will perform best in the real world, and to explain why. The explanations are produced by either greedy (chosen as a baseline due to its performance in the simulated user experiment) or LIME, and the instances are selected either by random (RP) or submodular pick (SP). We modify the greedy step in Algorithm 2 slightly so it alternates between explanations of the two classifiers. For each setting, we repeat the experiment with 100 users.
我们在亚马逊Mechanical Turk上招募人类研究对象——绝不是机器学习专家,而是对宗教有基本了解的人。我们通过查看相关原始数据的并排解释来衡量他们选择更好算法的能力(如图2所示)。我们将每个解释中的字数(K)和每个人检查的文档数(B)限制为6。每个算法的位置和看到的实例的顺序在受试者之间随机化。在检查这些解释之后,用户被要求选择哪种算法在现实世界中表现最好,并解释原因。解释是由贪婪(由于其在模拟用户实验中的性能而被选为基线)或LIME产生的,实例是由随机(RP)或子模选取(SP)产生的。我们稍微修改了算法2中的贪心步骤,以便在两个分类器的解释之间进行交替。对于每个设置,我们用100个用户重复这个实验。
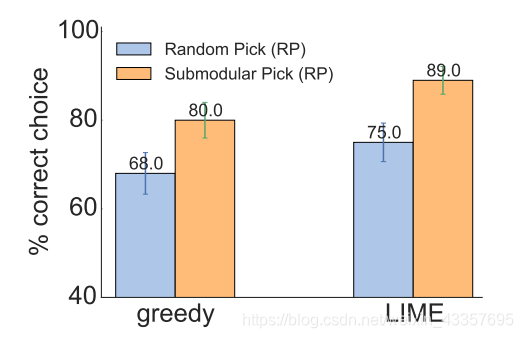
Figure 9: Average accuracy of human subject (with standard errors) in choosing between two classifiers.
图9:人类受试者在两个分类器之间选择的平均准确率(有标准误差)。
The results are presented in Figure 9. The first thing to note is that all of the methods are good at identifying the better classifier, demonstrating that the explanations are useful in determining which classifier to trust, while using test set accuracy would result in the selection of the wrong classifier. Further, we see that the submodular pick (SP) greatly improves the user’s ability to select the best classifier when compared to random pick (RP), with LIME outperforming greedy in both cases. While a few users got confused and selected a classifier for arbitrary reasons, most indicated that the fact that one of the classifiers clearly utilized more semantically meaningful words was critical to their selection.
结果如图9所示。首先要注意的是,所有的方法都能很好地识别出更好的分类器,说明这些解释在确定要信任的分类器时是有用的,而使用测试集的准确性会导致选择错误的分类器。此外,我们还发现,与随机选取(RP)相比,子模选取(SP)极大地提高了用户选择最佳分类器的能力,在这两种情况下,LIME的性能都优于greedy。虽然少数用户感到困惑,并出于任意原因选择了一个分类器,但大多数用户表示,其中一个分类器显然使用了语义意义更大的词,这一事实对他们的选择至关重要。
6.3 Can non-experts improve a classifier?非专家能改进分类器吗?
If one notes a classifier is untrustworthy, a common task in machine learning is feature engineering, i.e. modifying the set of features and retraining in order to improve generalization and make the classifier trustworthy. Explanations can aid in this process by presenting the important features, especially for removing features that the users feel do not generalize.
如果一个分类器是不可信的,机器学习中的一个常见任务就是特征工程,即修改特征集并进行再训练,以提高泛化能力,使分类器可信。通过介绍重要的特性,特别是删除用户认为不能概括的特性,说明可以在这个过程中提供帮助。
We use the 20 newsgroups data here as well, and ask Amazon Mechanical Turk users to identify which words from the explanations should be removed from subsequent training, in order to improve the worse classifier from the previous section. At each round of interaction, the subject marks words for deletion while seeing B = 10 instances with K = 10 words in each explanation (an interface similar to Figure 2, but with a single algorithm). As a reminder, the users here are not experts in machine learning and are unfamiliar with feature engineering, thus are only identifying words based on their semantic content. Further, users do not have any access to the religion dataset - they do not even know of its existence. We start the experiment with 10 subjects. After they mark words for deletion, we train 10 different classifiers, one for each subject (with the corresponding words removed). The explanations for each classifier are then presented to a set of 5 users in a new round of interaction, which results in 50 new classifiers. We do a final round, after which we have 250 classifiers, each with a path of interaction tracing back to the first 10 subjects.
我们在这里也使用了20个新闻组的数据,并要求Amazon-Mechanical-Turk用户确定应该从后续训练中删除解释中的哪些单词,以便改进上一节中更差的分类器。在每一轮交互中,受试者标记要删除的单词,同时在每个解释中看到B=10个实例,K=10个单词(一个类似于图2的界面,但是有一个单一的算法)。提醒一下,这里的用户不是机器学习专家,对特征工程也不熟悉,因此只能根据语义内容识别单词。此外,用户无法访问宗教数据集——他们甚至不知道它的存在。我们从10个受试者开始实验。在他们标记要删除的单词之后,我们训练10个不同的分类器,每个主题一个(删除相应的单词)。在新一轮的交互中,每个分类器的解释将呈现给一组5个用户,这将产生50个新的分类器。我们做最后一轮,之后我们有250个分类器,每个分类器都有一个可以追溯到前10个主题的交互路径。
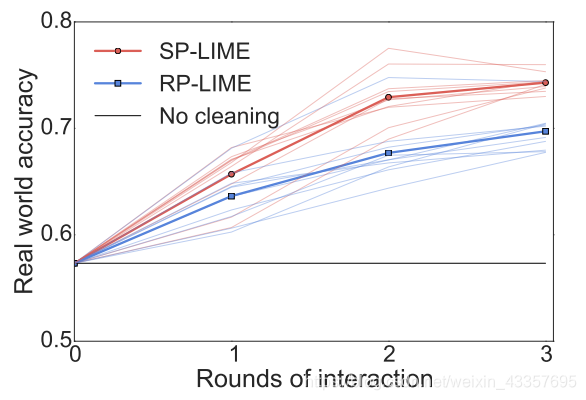
Figure 10: Feature engineering experiment. Each shaded line represents the average accuracy of subjects in a path starting from one of the initial 10 subjects. Each solid line represents the average across all paths per round of interaction.
图10:特征工程实验。每条阴影线表示从最初10个受试者中的一个开始的路径中受试者的平均精确度。每条实线表示每轮交互中所有路径的平均值。
The explanations and instances shown to each user are produced by SP-LIME or RP-LIME. We show the average accuracy on the religion dataset at each interaction round for the paths originating from each of the original 10 subjects (shaded lines), and the average across all paths (solid lines) in Figure 10. It is clear from the figure that the crowd workers are able to improve the model by removing features they deem unimportant for the task. Further, SP-LIME outperforms RP-LIME, indicating selection of the instances is crucial for efficient feature engineering.
向每个用户展示的解释和实例是由SP-LIME或RP-LIME生成的。我们展示了宗教数据集在每一轮互动中,原始10个受试者(阴影线)路径的平均准确度,所有路径的平均值(实线)如图10所示。从图中可以明显看出,群组工作人员可以通过删除他们认为对任务不重要的特性来改进模型。此外,SP-LIME的性能优于RP-LIME,这表明实例的选择对于有效的特征工程是至关重要的。
It is also interesting to observe that paths where the initial users do a relatively worse job in selecting features are later fixed by the subsequent users.
同样有趣的是,初始用户在选择特性时表现相对较差的路径后来被后续用户修复。
Each subject took an average of 3.6 minutes per round of cleaning, resulting in just under 11 minutes to produce a classifier that generalizes much better to real world data. Each path had on average 200 words removed with SP, and 157 with RP, indicating that incorporating coverage of important features is useful for feature engineering. Further, out of an average of 200 words selected with SP, 174 were selected by at least half of the users, while 68 by all the users. Along with the fact that the variance in the accuracy decreases across rounds, this high agreement demonstrates that the users are converging to similar correct models. This evaluation is an example of how explanations make it easy to improve an untrustworthy classifier – in this case easy enough that machine learning knowledge is not required.
每一个受试者平均每轮清洗需要3.6分钟,结果只有不到11分钟的时间来生成一个分类器,它能更好地概括真实世界的数据。每个路径平均有200个单词被SP删除,157个单词被RP删除,这表明合并重要特征的覆盖对于特征工程是有用的。此外,在用SP选择的平均200个单词中,至少有一半的用户选择了174个,而所有用户选择了68个。随着各轮精度差异的减小,这种高度一致性表明用户正在收敛到类似的正确模型。这个评估是一个例子,说明了如何解释如何使改进一个不可信的分类器变得容易——在这种情况下,它足够容易,不需要机器学习知识。
6.4 Do explanations lead to insights? 解释是否能带来见解?
Often artifacts of data collection can induce undesirable correlations that the classifiers pick up during training. These issues can be very difficult to identify just by looking at the raw data and predictions.
通常,数据收集的伪影会导致分类器在训练过程中发现不需要的相关性。仅仅通过查看原始数据和预测就很难确定这些问题。
In an effort to reproduce such a setting, we take the task of distinguishing between photos of Wolves and Eskimo Dogs (huskies). We train a logistic regression classifier on a training set of 20 images, hand selected such that all pictures of wolves had snow in the background, while pictures of huskies did not. As the features for the images, we use the first max-pooling layer of Google’s pre-trained Inception neural network [25]. On a collection of additional 60 images, the classifier predicts “Wolf” if there is snow (or light background at the bottom), and “Husky” otherwise, regardless of animal color, position, pose, etc. We trained this bad classifier intentionally, to evaluate whether subjects are able to detect it.
为了重现这样的场景,我们的任务是区分狼和爱斯基摩狗的照片。我们在20幅图像的训练集上训练一个logistic回归分类器,手工选择,使得所有狼的图片背景都有雪,而哈士奇的图片背景没有雪。作为图像的特征,我们使用Google预先训练的Inception神经网络的第一个最大池层[25]。在另外60幅图像的集合上,分类器预测“狼”是否有雪(或底部的光背景),否则预测“哈士奇”,而不管动物的颜色、位置、姿势等。我们故意训练这个糟糕的分类器,以评估受试者是否能够检测到它。
The experiment proceeds as follows: we first present a balanced set of 10 test predictions (without explanations), where one wolf is not in a snowy background (and thus the prediction is “Husky”) and one husky is (and is thus predicted as “Wolf”). We show the “Husky” mistake in Figure 11a. The other 8 examples are classified correctly. We then ask the subject three questions: (1) Do they trust this algorithm to work well in the real world, (2) why, and (3) how do they think the algorithm is able to distinguish between these photos of wolves and huskies. After getting these responses, we show the same images with the associated explanations, such as in Figure 11b, and ask the same questions.
实验进行如下:我们首先提出一组10个测试预测(没有解释),其中一只狼不在雪地背景中(因此预测是“哈士奇”),一只哈士奇是(因此预测是“狼”)。我们在图11a中显示了“Husky”错误。其余8例分类正确。然后我们问受试者三个问题:(1)他们是否相信这个算法在现实世界中能很好地工作,(2)为什么,(3)他们认为这个算法能够区分狼和哈士奇的照片。在得到这些回答之后,我们展示了相同的图像和相关的解释,如图11b所示,并提出了相同的问题。
Since this task requires some familiarity with the notion of spurious correlations and generalization, the set of subjects for this experiment were graduate students and professors in machine learning and its applications (NLP, Vision, etc.). After gathering the responses, we had 3 independent evaluators read their reasoning and determine if each subject mentioned snow, background, or equivalent as a potential feature the model may be using. We pick the majority as an indication of whether the subject was correct about the insight, and report these numbers before and after showing the explanations in Table 2.
由于这项任务需要对伪相关和泛化的概念有一定的了解,因此本实验的研究对象是机器学习及其应用(NLP、Vision等)的研究生和教授。在收集了回答之后,我们让3个独立的评估者阅读他们的推理,并确定每个受试者是否提到雪、背景或等效物作为模型可能使用的潜在特征。我们选择大多数作为受试者关于洞察力是否正确的指示,并在表2中显示解释之前和之后报告这些数字。
Before observing the explanations, more than a third trusted the classifier, a somewhat low number since we presented only 10 examples. They did speculate as to what the neural network was picking up on, and a little less than half mentioned the snow pattern as a possible cause. After examining the explanations, however, almost all of the subjects identified the correct insight, with much more certainty that it was a determining factor. Further, the trust in the classifier also dropped substantially. Although our sample size is small, this experiment demonstrates the utility of explaining individual predictions for getting insights into classifiers knowing when not to trust them and why. Figuring out the best interfaces and doing further experiments in this area (in particular with real machine learning based services) is an exciting direction for future research.
在观察这些解释之前,超过三分之一的人信任分类器,因为我们只给出了10个例子,所以这个数字有点低。他们确实推测了神经网络的作用,只有不到一半的人提到雪的形状是可能的原因。然而,在研究了这些解释之后,几乎所有的受试者都确定了正确的洞察力,更确定的是,这是一个决定性的因素。此外,对分类器的信任度也大幅下降。虽然我们的样本量很小,但这个实验证明了解释个体预测的效用,可以帮助分类器了解何时不信任他们以及为什么不信任他们。找出最佳的接口并在这一领域做进一步的实验(特别是使用真正的基于机器学习的服务)是未来研究的一个令人兴奋的方向。
7 Related Work 相关工作
The problems with relying on validation set accuracy as the primary measure of trust have been well studied. Practitioners consistently overestimate their model’s accuracy [21], propagate feedback loops [23], or fail to notice data leaks [14]. In order to address these issues, researchers have proposed tools like Gestalt [22] and Modeltracker [1], which help users navigate individual instances. These tools are complementary to LIME in terms of explaining models, since they do not address the problem of explaining individual predictions - instead they let the user browse raw data or features. Further, our submodular pick procedure can be incorporated in such tools to aid users in navigating larger datasets.
依赖验证集准确性作为信任的主要度量的问题已经得到了很好的研究。从业者总是高估他们模型的准确性[21],传播反馈循环[23],或者没有注意到数据泄漏[14]。为了解决这些问题,研究人员提出了格式塔[22]和Modeltracker[1]等工具,帮助用户浏览各个实例。这些工具在解释模型方面是对LIME的补充,因为它们不解决解释单个预测的问题,而是让用户浏览原始数据或特征。此外,我们的子模块pick过程可以合并到这些工具中,以帮助用户导航更大的数据集。
Some recent work aims to anticipate failures in machine learning, specifically for vision tasks [3, 29]. Letting users know when the systems are likely to fail can lead to an increase in trust, by avoiding “silly mistakes” [7]. These solutions either require additional annotations and feature engineering that is specific to vision tasks or do not provide insight into why a decision should not be trusted. Furthermore, they assume that the current evaluation metrics are reliable, which may not be the case if problems such as data leakage are present. Other recent work [10] focuses on exposing users to different kinds of mistakes (our pick step). Interestingly, the subjects in their study did not notice the serious problems in the 20 newsgroups data even after looking at many mistakes, suggesting that examining raw data is not sufficient. Note that Groce et al. [10] are not alone in this regard, many researchers in the field have unwittingly published classifiers that would not generalize for this task. Using LIME, we show that even non-experts are able to identify these irregularities when explanations are present. Further, LIME can complement these existing systems, and allow users to assess trust even when a prediction seems “correct” but is made for the wrong reasons.
最近的一些工作旨在预测机器学习的失败,特别是视觉任务[3,29]。通过避免“愚蠢的错误”,让用户知道系统何时可能会失败,可以增加信任度[7]。这些解决方案要么需要额外的注释和特定于远景任务的特性工程,要么无法洞察为什么决策不可信。此外,他们假设当前的评估指标是可靠的,如果存在数据泄漏等问题,则情况可能并非如此。最近的其他工作[10]侧重于将用户暴露在不同类型的错误中(我们的选择步骤)。有趣的是,研究中的受试者即使看了很多错误,也没有注意到20个新闻组数据中存在的严重问题,这表明仅仅检查原始数据是不够的。值得注意的是,Groce等人[10]在这方面并不孤单,该领域的许多研究人员无意中发表了不会概括这项任务的分类器。使用LIME,我们表明,即使是非专家能够识别这些不规则时,解释存在。此外,LIME可以补充这些现有系统,并允许用户评估信任,即使预测看起来“正确”,但出于错误的原因。
Recognizing the utility of explanations in assessing trust, many have proposed using interpretable models [27], especially for the medical domain [6, 17, 26]. While such models may be appropriate for some domains, they may not apply equally well to others (e.g. a supersparse linear model [26] with 5 − 10 features is unsuitable for text applications). Interpretability, in these cases, comes at the cost of flexibility, accuracy, or efficiency. For text, EluciDebug [16] is a full human-in-the-loop system that shares many of our goals (interpretability, faithfulness, etc). However, they focus on an already interpretable model (Naive Bayes). In computer vision, systems that rely on object detection to produce candidate alignments [13] or attention [28] are able to produce explanations for their predictions. These are, however, constrained to specific neural network architectures or incapable of detecting “non object” parts of the images. Here we focus on general, model-agnostic explanations that can be applied to any classifier or regressor that is appropriate for the domain - even ones that are yet to be proposed.
认识到解释在评估信任中的效用,许多人建议使用可解释模型[27],特别是在医学领域[6,17,26]。虽然这些模型可能适用于某些领域,但它们可能并不同样适用于其他领域(例如,具有5的超解析线性模型[26])− 10个功能不适合文本应用程序)。在这些情况下,可解释性是以牺牲灵活性、准确性或效率为代价的。对于文本来说,EluciDebug[16]是一个完整的人在回路系统,它与我们的许多目标(可解释性、忠实性等)相同。然而,他们关注的是一个已经可以解释的模型(朴素贝叶斯)。在计算机视觉中,依靠目标检测产生候选对齐[13]或注意力[28]的系统能够对其预测产生解释。然而,这些都局限于特定的神经网络结构或无法检测图像的“非对象”部分。在这里,我们集中在一般的,模型不可知的解释,可以适用于任何分类器或回归是适合的领域-甚至那些尚未提出。
A common approach to model-agnostic explanation is learning a potentially interpretable model on the predictions of the original model [2]. Having the explanation be a gradient vector captures a similar locality intuition to that of LIME. However, interpreting the coefficients on the gradient is difficult, particularly for confident predictions (where gradient is near zero). Further, the model that produces the gradient is trained to approximate the original model globally. When the number of dimensions is high, maintaining local fidelity for such models becomes increasingly hard, as our experiments demonstrate. In contrast, LIME solves the much more feasible task of finding a model that approximates the original model locally. The idea of perturbing inputs for explanations has been explored before [24], where the authors focus on learning a specific contribution model, as opposed to our general framework. None of these approaches explicitly take cognitive limitations into account, and thus may produce noninterpretable explanations, such as a gradients or linear models with thousands of non-zero weights. The problem becomes worse if the original features are nonsensical to humans (e.g. word embeddings). In contrast, LIME incorporates interpretability both in the optimization and in our notion of interpretable representation, such that domain and task specific interpretability criteria can be accommodated.
模型不可知解释的一种常见方法是在原始模型预测的基础上学习一个潜在的可解释模型[2]。用梯度向量来解释与LIME相似的局部直觉。然而,解释梯度上的系数是困难的,特别是对于有信心的预测(梯度接近于零)。此外,产生梯度的模型被训练成全局逼近原始模型。我们的实验表明,当维数较高时,保持这种模型的局部保真度变得越来越困难。相比之下,LIME解决了更可行的任务,即找到一个局部逼近原始模型的模型。在[24]之前已经探讨过扰动输入来解释的想法,在这里,作者专注于学习一个特定的贡献模型,而不是我们的一般框架。这些方法都没有明确考虑到认知的局限性,因此可能产生无法解释的解释,例如带有数千个非零权重的梯度或线性模型。如果原始特征对人类来说毫无意义(例如单词嵌入),问题就会变得更糟。相比之下,LIME在优化和可解释表示的概念中都包含了可解释性,这样就可以适应特定领域和特定任务的可解释性标准。
8 Conclusion and Future Work 结论与未来工作
In this paper, we argued that trust is crucial for effective human interaction with machine learning systems, and that explaining individual predictions is important in assessing trust. We proposed LIME, a modular and extensible approach to faithfully explain the predictions of any model in an interpretable manner. We also introduced SP-LIME, a method to select representative and non-redundant predictions, providing a global view of the model to users. Our experiments demonstrated that explanations are useful for trust-related tasks: deciding between models, assessing trust, improving untrustworthy models, and getting insights into predictions.
在这篇论文中,我们认为信任对于人类与机器学习系统的有效交互是至关重要的,而解释个体的预测对于评估信任是很重要的。我们提出了LIME,一种模块化的、可扩展的方法,以一种可解释的方式忠实地解释任何模型的预测。我们还介绍了SP-LIME,一种选择有代表性和无冗余预测的方法,为用户提供模型的全局视图。我们的实验证明,解释对于信任相关的任务是有用的:在模型之间做出决定、评估信任、改进不可信模型以及洞察预测。
There are a number of avenues of future work that we would like to explore. Although we describe only sparse linear models as explanations, our framework supports the exploration of a variety of explanation families, such as decision trees; it would be interesting to see a comparative study on these with real users. One issue that we do not mention in this work was how to perform the pick step for images, and we would like to address this limitation in the future. The domain and model agnosticism enables us to explore a variety of applications, and we would like to investigate potential uses in speech, video, and medical domains. Finally, we would like to explore theoretical properties (such as the appropriate number of samples) and computational optimizations (such as using parallelization and GPU processing), in order to provide the accurate, real-time explanations that are critical for any human-in-the-loop machine learning system.
我们希望探讨今后工作的若干途径。虽然我们只描述稀疏线性模型作为解释,我们的框架支持各种解释族的探索,如决策树;这将是有趣的,看看比较研究这些与实际用户。我们在这项工作中没有提到的一个问题是如何对图像执行pick步骤,我们希望在将来解决这个限制。领域和模型不可知论使我们能够探索各种各样的应用,我们希望研究在语音、视频和医学领域的潜在用途。最后,我们希望探讨理论性质(例如适当的样本数)和计算优化(例如使用并行化和GPU处理),以便提供对任何人在回路机器学习系统都至关重要的准确、实时的解释。
References 参考文献
[1] S. Amershi, M. Chickering, S. M. Drucker, B. Lee, P. Simard, and J. Suh. Modeltracker: Redesigning performance analysis tools for machine learning. In Human Factors in Computing Systems (CHI), 2015.
[2] D. Baehrens, T. Schroeter, S. Harmeling, M. Kawanabe, K. Hansen, and K.-R. Müller. How to explain individual classification decisions. Journal of Machine Learning Research, 11, 2010.
[3] A. Bansal, A. Farhadi, and D. Parikh. Towards transparent systems: Semantic characterization of failure modes. In European Conference on Computer Vision (ECCV), 2014.
[4] J. Blitzer, M. Dredze, and F. Pereira. Biographies, bollywood, boom-boxes and blenders: Domain adaptation for sentiment classification. In Association for Computational Linguistics (ACL), 2007.
[5] J. Q. Candela, M. Sugiyama, A. Schwaighofer, and N. D. Lawrence. Dataset Shift in Machine Learning. MIT, 2009.
[6] R. Caruana, Y. Lou, J. Gehrke, P. Koch, M. Sturm, and N. Elhadad. Intelligible models for healthcare: Predicting pneumonia risk and hospital 30-day readmission. In Knowledge Discovery and Data Mining (KDD), 2015.
[7] M. T. Dzindolet, S. A. Peterson, R. A. Pomranky, L. G. Pierce, and H. P. Beck. The role of trust in automation reliance. Int. J. Hum.- Comput. Stud., 58(6), 2003.
[8] B. Efron, T. Hastie, I. Johnstone, and R. Tibshirani. Least angle regression. Annals of Statistics, 32:407–499, 2004.
[9] U. Feige. A threshold of ln n for approximating set cover. J. ACM, 45(4), July 1998.
[10] A. Groce, T. Kulesza, C. Zhang, S. Shamasunder, M. Burnett, W.-K. Wong, S. Stumpf, S. Das, A. Shinsel, F. Bice, and K. McIntosh. You are the only possible oracle: Effective test selection for end users of interactive machine learning systems. IEEE Trans. Softw. Eng., 40(3), 2014.
[11] T. Hastie, R. Tibshirani, and J. Friedman. The Elements of Statistical Learning. Springer New York Inc., 2001.
[12] J. L. Herlocker, J. A. Konstan, and J. Riedl. Explaining collaborative filtering recommendations. In Conference on Computer Supported Cooperative Work (CSCW), 2000.
[13] A. Karpathy and F. Li. Deep visual-semantic alignments for generating image descriptions. In Computer Vision and Pattern Recognition (CVPR), 2015.
[14] S. Kaufman, S. Rosset, and C. Perlich. Leakage in data mining: Formulation, detection, and avoidance. In Knowledge Discovery and Data Mining (KDD), 2011.
[15] A. Krause and D. Golovin. Submodular function maximization. In Tractability: Practical Approaches to Hard Problems. Cambridge University Press, February 2014.
[16] T. Kulesza, M. Burnett, W.-K. Wong, and S. Stumpf. Principles of explanatory debugging to personalize interactive machine learning. In Intelligent User Interfaces (IUI), 2015.
[17] B. Letham, C. Rudin, T. H. McCormick, and D. Madigan. Interpretable classifiers using rules and bayesian analysis: Building a better stroke prediction model. Annals of Applied Statistics, 2015.
[18] D. Martens and F. Provost. Explaining datadriven document classifications. MIS Q., 38(1), 2014.
[19] T. Mikolov, I. Sutskever, K. Chen, G. S. Corrado, and J. Dean. Distributed representations of words and phrases and their compositionality. In Neural Information Processing Systems (NIPS). 2013.
[20] A. Newell. Human Problem Solving. PrenticeHall, Inc., 1972.
[21] K. Patel, J. Fogarty, J. A. Landay, and B. Harrison. Investigating statistical machine learning as a tool for software development. In Human Factors in Computing Systems (CHI), 2008.
[22] K. Patel, N. Bancroft, S. M. Drucker, J. Fogarty, A. J. Ko, and J. Landay. Gestalt: Integrated support for implementation and analysis in machine learning. In User Interface Software and Technology (UIST), 2010. [23] D. Sculley, G. Holt, D. Golovin, E. Davydov, T. Phillips, D. Ebner, V. Chaudhary, M. Young, and J.-F. Crespo. Hidden technical debt in machine learning systems. In Neural Information Processing Systems (NIPS). 2015.
[24] E. Strumbelj and I. Kononenko. An efficient explanation of individual classifications using game theory. Journal of Machine Learning Research, 11, 2010.
[25] C. Szegedy, W. Liu, Y. Jia, P. Sermanet, S. Reed, D. Anguelov, D. Erhan, V. Vanhoucke, and A. Rabinovich. Going deeper with convolutions. In Computer Vision and Pattern Recognition (CVPR), 2015.
[26] B. Ustun and C. Rudin. Supersparse linear integer models for optimized medical scoring systems. Machine Learning, 2015.
[27] F. Wang and C. Rudin. Falling rule lists. In Artificial Intelligence and Statistics (AISTATS), 2015.
[28] K. Xu, J. Ba, R. Kiros, K. Cho, A. Courville, R. Salakhutdinov, R. Zemel, and Y. Bengio. Show, attend and tell: Neural image caption generation with visual attention. In International Conference on Machine Learning (ICML), 2015.
[29] P. Zhang, J. Wang, A. Farhadi, M. Hebert, and D. Parikh. Predicting failures of vision systems. In Computer Vision and Pattern Recognition (CVPR), 2014.
总结
后续会在对该文章进行解释与重点标记