一、四种方法
legend()
legend(handles, labels)
legend(handles=handles)
legend(labels)
1 legend()
labels自动通过绘图获取(Automatic detection of elements to be shown in the legend)
# 第一种方法
ax.plot([1, 2, 3], label='Inline label')
ax.legend()
# 第二种方法
line, = ax.plot([1, 2, 3])
line.set_label('Label via method')
ax.legend()
2 legend(handles, labels)
明确列出(Explicitly listing the artists and labels in the legend)
ax.legend([line1, line2, line3], ['label1', 'label2', 'label3'])
3 legend(handles=handles)
只列出handles(Explicitly listing the artists in the legend)
line1, = ax.plot([1, 2, 3], label='label1')
line2, = ax.plot([1, 2, 3], label='label2')
ax.legend(handles=[line1, line2])
4 legend(labels)
只列出labels,不推荐,因为绘图元素和标签之间的关系仅通过它们的顺序来隐含,并且很容易混淆。
ax.plot([1, 2, 3])
ax.plot([5, 6, 7])
ax.legend(['First line', 'Second line'])
二、重要参数
1 handlessequence of Artist, optional
要添加到图例中的绘图元素。
A list of Artists (lines, patches) to be added to the legend.
2 labels list of str, optional
绘图元素旁边的标签。
A list of labels to show next to the artists.
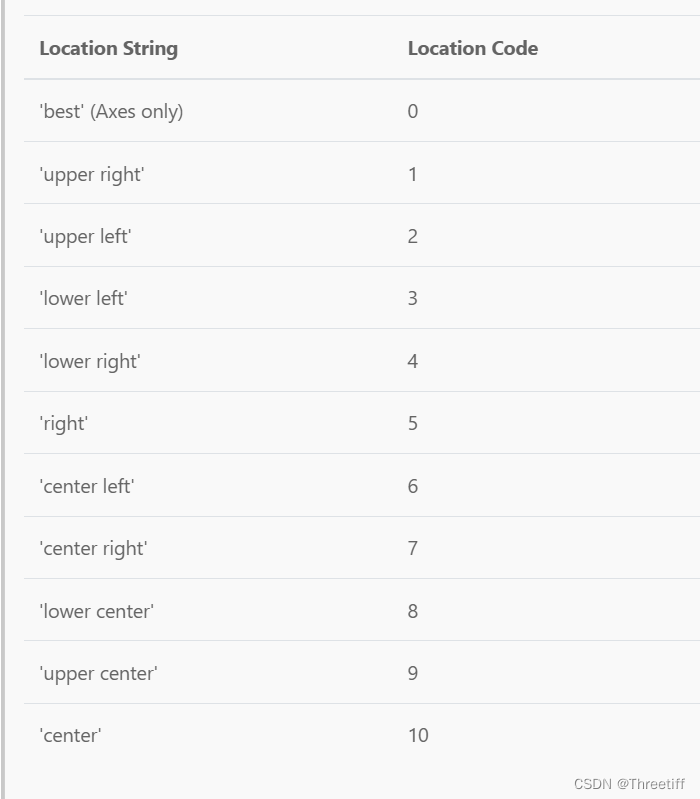
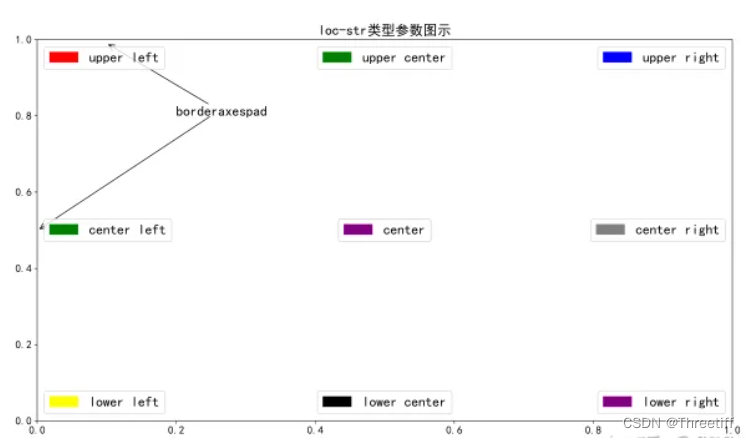
3 loc (default: 'best'**)
控制图例的位置(当设置图例的位置时,先设置这个参数!!!)
4 bbox_to_anchor
2-tuple或者4-tuple。一般我们使用2-tuple
与loc一起使用的控制legend的位置框,该参数能够进行图例任意位置的调节
**注意:bbox_to_anchor和loc一起使用!
如果是4-tuple, 分别表示
(x, y, width, height)x表示横轴,x=0是最左侧
y表示y轴,y=0是最下侧
width表示宽度
height表示高度
一个例子:
#
loc='upper right', bbox_to_anchor=(0.5, 0.0, 0.5, 0.5)
如果是2-tuple, 分别表示
(x, y)注意:当使用loc=(x,y)时,x, y并不是轴域中实际的x, y的值,而是将x轴, y轴分别看成1,
即:(x/(x_max-x_min), y/(y_max-y_min))(归1处理);
x越大越向右
y越大越向上
一个例子:
# 如果不设置loc,默认将图例的【左下角】放在图的(0.5, 0.5)
bbox_to_anchor=(0.5, 0.5)

# 如果设置了loc
# 将图例的右上角点放在图的(0.5, 0.5)的位置【这个很重要】
loc='upper right', bbox_to_anchor=(0.5, 0.5)
# 将图例的右上角点放在图的(0.5, 0.5)【这个很重要】
loc='upper left', bbox_to_anchor=(0.5, 0.5)
5 prop None or FontProperties or dict
设置图例的字体属性,一般用字典最方便
prop={‘weight’: ‘bold’, ‘size’: 12}
6 ncols int, default: 1
图例的列数
7 markerfirst bool, default: True
如果为True,则图例标记将放置在图例标签的左侧。
如果为False,图例标记将放置在图例标签的右侧。
8 frameon default: True
是否在图例外画框
9 mode {“expand”, None}
如果是"expand",图例将水平展开以填充轴区域(如果定义图例的大小,则为bbox_to_anchor)。
总结
1 多个子图共用一个图例使用
fig.legend()2 多个子图【每一个图使用一个图例】使用
ax.legend()3 位置大调用
loc4 利用
**bbox_to_anchor**可随意设置图例的位置【图里或者图外都可以】
学习链接:
- https://matplotlib.org/stable/api/_as_gen/matplotlib.pyplot.legend.html
- matplotlib 到底该如何控制legend的位置之一? - 知乎 (zhihu.com)
- Matplotlib 多个子图使用一个图例_matplotlib子图共用图例_Mepleleo的博客-CSDN博客