图表的常用设置
1.添加文本标签
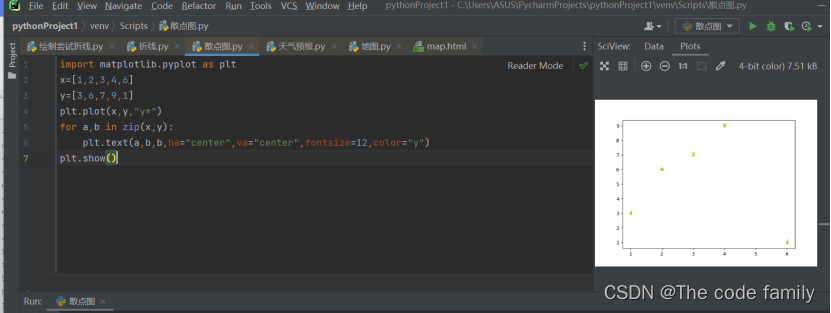
matplotlib.pyplot.text(x,y,s,**kwargs)
| 通用绘图参数 |
说明 |
| fontsize |
字体大小 |
| ha |
水平对齐方式 |
| va |
垂直对齐方式 |
for a,b in zip(x,y):
plt.text(a,b,b,ha="center",va="center",fontsize=12,color="y")
2.设置标题(整个图表的标题)和图例
matplotlib.pyplot.title()
matplotlib.pyplot.lengend()
| 位置 |
说明 |
| best |
自适应 |
| upper right |
右上方 |
| upper left |
左上方 |
| lower right |
右下方 |
| lower left |
左下方 |
| right |
右侧 |
| center left |
左中间 |
| center right |
右中间 |
| upper center |
上中间 |
| center |
正中央 |
| lower center |
下中间 |

plt.title("散点图",fontsize=20)#添加标题
plt.legend("MAX",fontsize=12)#添加图例
注意中文乱码问题,之前文章已经发布过解决办法。