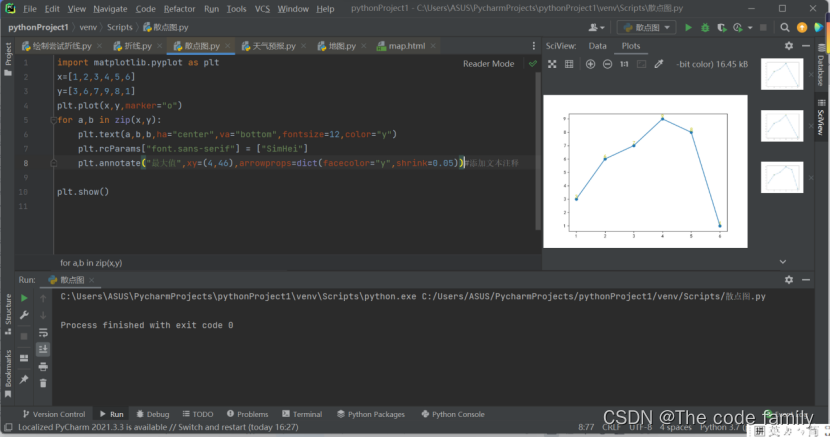
1.添加注释
matplotlib.pyplot.annotate(s,xy,xytext,xycoords,arrowprops)
2.调整图表与画布边缘间距
matplotlib.pyplot.subplots_adjust(left,right,top,bottom)

注意:Left,bottom值越大,间距越小;right,top值越小,间距越大。
坐标轴的刻度线
首先设置刻度线是否显示,然后再确定方向
matplotlib.pyplot.tick_params(bottom,left,rihgt,top)
matplotlib.pyplot.tick_params(bottom=False,left=True,rihgt=True,top=True)#底层不显示
plt.rcParams["xtick.direction"]="in" # 设置坐标轴刻度线显示方向
plt.rcParams["ytick.direction”]="out"