首先到xdebug官网下载和你的php版本一致的xdebug扩展,我的是php-5.4.29-Win32-VC9-x86,所以下载的是php_xdebug-2.4.0rc3-5.4-vc9.dll
把php_xdebug-2.4.0rc3-5.4-vc9.dll复制到php的目录下,我是复制到 H:\phpStudy\php\php_xdebug-2.4.0rc3-5.4-vc9.dll(用的phpstudy集成环境)
修改php.ini配置如下,我关闭了部分保存分析文件的配置,这样对网站速度影响小一些。。
[Xdebug]
;你的xdebug文件路径,不要有空格和中文名之类的就不用再多说了。。
zend_extension=H:/phpStudy/php/php_xdebug-2.4.0rc3-5.4-vc9.dll
;开启自动跟踪
xdebug.auto_trace = Off
;开启异常跟踪
xdebug.show_exception_trace = Off
;开启远程调试自动启动
xdebug.remote_autostart = On
;开启远程调试
xdebug.remote_enable = On
;收集变量
xdebug.collect_vars = Off
;收集返回值
xdebug.collect_return = Off
;收集参数
xdebug.collect_params = Off
xdebug.trace_output_dir="H:/phpStudy/php/Projecs"
xdebug.profiler_enable=Off
xdebug.profiler_output_dir="H:/phpStudy/php/Projecs"
xdebug.remote_host=localhost
xdebug.remote_port=9000
xdebug.remote_handler=dbgp
修改Hbuilder配置。
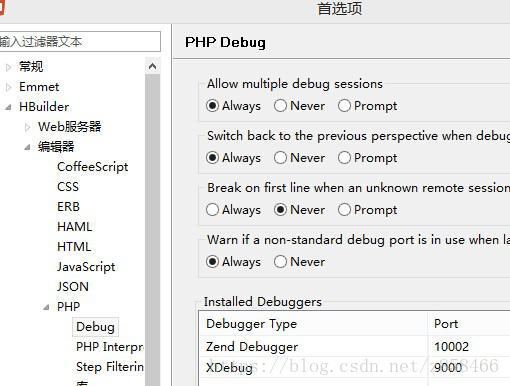
只需要把端口号改成php.ini里面配置的就行了,然后在php文件上加个断点,访问下浏览器,看下会不会停下来。。。
需要补充的一点是在windows下php最大执行时间好像是30秒,可能会影响到调试,我的已经改成max_execution_time=6000
足足100分钟了。。如果遇到问题可以把这里改大点 。。
然后进入断点会有个提示:breakpoint at first line,选是的话会默认从第一行进入断点,可以选否,或者也可以自己 设置
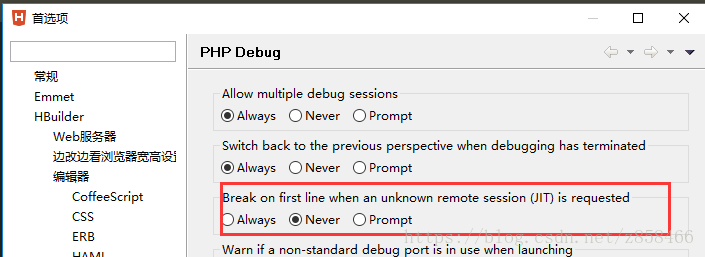
这样就会从断点处开始。。。