很多同学在BELLHOP Actup使用过程中发现存在程序代码的缺失等问题,无法很好的工作。这里提供了本人编写的Actup使用说明书点击打开链接,以及相关代码点击打开链接。本人能力和水平有限,欢迎大家批评指正。
这里本文以正弦波信号为例,对输入信号通过BELLHOP得到的单位冲激响应进行计算得到输出响应。
(1)设置发射参数。
这里设置采样频率为1600kHz;发射中心频率为160kHz,发射声源级为185dB,带宽为8kHz。这里通过.arr文件获取单位冲激响应。具体方式请参考本人编写的使用说明书。
%by Dongtaishan
%Last updated on April 17, 2018
clear; close all; clc;

%采样率
sampling_rate=1600e3;

%发射机中心频率
%该值和计算噪声有关
fc=160e3;

radio=sampling_rate/fc  %采样率与中心频率的比值
%发射机参数
sl_db=185;  %发射机声源级
bw=8e3;     %带宽

%通过Actup的arr文件获取所需的幅值和时延(单位冲激响应)
% %BELLHOP run ID
% env_id='';
% %read BELLHOP arr file:
% [ amp1, delay1, SrcAngle, RcvrAngle, NumTopBnc, NumBotBnc, narrmat, Pos ] ...
%     = read_arrivals_asc( [env_id '.arr'] ) ;
% [m,n]=size(amp1);
% amp=amp1(m,:);
% delay=delay1(m,:);
load delay
load amp
%风力等级
windspeed=5;
(2)设置发射数据。这里设置发送数据和通信速率,并加以采样得到采样后的波形。
%Step 1: 创建任意波形(这里以正弦波为例)
%%%%%%%%%%%%%%%%%%%%%%%%%%%%%%%%%%%%%%%%%%%%%%%%%%%%%%%%%%%%%%%%%%%%%%%%%%
F_Serial_Signal=[zeros(1,1),ones(1,1),zeros(1,10)];  %待发送串行数据
Signal_L=length(F_Serial_Signal);                    %发送数据长度
communication_rate=40e3;                       %通信速率
Communication_radio= sampling_rate/communication_rate; %采样倍数
signal=repmat(F_Serial_Signal,Communication_radio,1);
signal2=reshape(signal,1,Signal_L*Communication_radio);      %调整后的数据
signal_length=length(signal2);                 %数据长度
t=0:1/sampling_rate:(signal_length-1)/sampling_rate;      %时间
modulation_signal=cos(2*pi()*fc*t);            %载波信号
tx_source=signal2.*modulation_signal;          %发送
(3)加入噪声和多径干扰。首先对由.arr文件获得的单位冲激响应进行采样,并计算噪声级和接收端接收信号的信噪比。其次,加入多径干扰(与单位冲激响应卷积)和噪声。
%Step 2:加入噪声和多径影响
%%%%%%%%%%%%%%%%%%%%%%%%%%%%%%%%%%%%%%%%%%%%%%%%%%%%%%%%%%%%%%%%%%%%%%%%%%
Narrmx=10; %limit ourselves to use the first Narrmax paths

%对单位冲激响应进行采样
ir_vec=bharr2ir(delay, amp, sampling_rate);
%strongest tap in dB
maxamp_db=20*log10(max(abs(amp)))+sl_db;%声源级(dB)加由于信道衰减的能量(dB),表示接收到的信号的能量

%噪声级
[npsd_db]=ambientnoise_psd(windspeed, fc);%npsd_db是噪声的能量谱密度(单位频带内的能量)转换成dB,
nv_db=npsd_db+10*log10(bw);%相当于能量谱密度乘以带宽,即该频带内的噪声的能量
% maxamp_db和nv_db的差值应该为信噪比
disp(['Strongest tap strength=' num2str(maxamp_db,'%.1f') ' dB; Noise variance=' num2str(nv_db,'%.1f') 'dB']);

%考虑多径和噪声影响后的接收信号响应
[rx_signal, adj_ir_vec]=uw_isi(ir_vec, maxamp_db, tx_source, nv_db);
单位冲激响应采样函数如下:
function ir_vec=bharr2ir(delay, amp, sampling_rate)
%ir_vec=bharr2ir(delay, amp, sampling_rate) converts BELLHOP arrival-time
%outputs to impulse responses.
%
%Input:
%   delay, amp: BELLHOP arrival delay and amplitude (complex)
%   sampling_rate: sampling rate of the impulse response
%
%Output:
%   ir_vec: impulse responses at the baseband, sampled at the sampling rate
%   specified
%
%by Dongtaishan
%Last updated on April 17, 2018
%去除0值
valid_delay_index=find(delay>0);
if isempty(valid_delay_index)
    disp('[bharr2ir]Error: Zero path simulated by BELLHOP.');
    return;
end
delay_vec=delay(valid_delay_index);
amp_vec=amp(valid_delay_index);

%单位冲激响应进行采样
delay_min=min(delay_vec);
delay_max=max(delay_vec);

cir_length=round(delay_max*sampling_rate);
ir_vec=zeros(cir_length, 1);

%find individual ray paths
for icn=1: length(delay_vec)
    %calculate the arrival index
    %init_delay gives some zeros priror to the first path
    arr_id=round(delay_vec(icn)*sampling_rate);

    %generate impulse response. Note that sometime, multiple returns can be
    %generate for the same delay in BELLHOP.
    ir_vec(arr_id)=ir_vec(arr_id)+amp_vec(icn);
end
考虑海洋湍流和风力函数如下:
function [npsd_db]=ambientnoise_psd(windspeed, fc)
%[npsd_db]=ambientnoise_psd(windspeed, fc) calculates ocean ambient noise
%power spectrum density for center frequecy fc (in hertz).
%
%Input:
%   windspeed: wind speed for ambient noise level calculation
%   fc: center frequency of the acoustic band
%
%Output:
%   npsd_db: noise power spectrum density in dB

%Turbulance noise湍流噪声
ANturb_dB=17-30*log10(fc/1000);

%Ambient noise in dB (wind driven noise)
ANwind_dB=50+7.5*sqrt(windspeed)+20*log10(fc/1000)-40*log10(fc/1000+0.4);

%Thermo noise in dB (wind driven noise)热噪声
ANthermo_dB=-15+20*log10(fc/1000);

%Total noise PSD
npsd_db=10*log10(10^(ANturb_dB/10)+10^(ANwind_dB/10)+10^(ANthermo_dB/10));
% %Noise variance=bandwidth*npsd_db, assuming a flat spectrum within the band.
% nv=npsd_db+10*log10(bandwidth);
%%%%%%%%%%%%%%%%%%%%%%%%%%%%%%%%%%%%%%%%%%%%%%%%%%%%%%%%%%%%%%%%%%%%%%%%%%%%%%%%%%%%%%
%End of file
%%%%%%%%%%%%%%%%%%%%%%%%%%%%%%%%%%%%%%%%%%%%%%%%%%%%%%%%%%%%%%%%%%%%%%%%%%%%%%%%%%%%%%%
与单位冲激响应函数卷积并加入噪声的函数如下:
function [y, adj_ir_vec]=uw_isi(ir_vec, sl_db, tx_source, nv_db)
%y=uw_isi(ir_vec, sl_db, tx_source, nv) simulate underwater ISI channel
%effects from multipath and ambient noisee
%
%Input:
%   ir_vec is the channel impulse response (in baseband)
%   sl_db is the source level in dB
%   tx_source is the source signal (in baseband)
%   nv_db is the noise level in dB
%
%Output:
%   y is the channel output
%   adj_ir_vec is the source level adjusted impulse response
%
%
%发送信号与信道冲激响应进行卷积
tx_sig=conv(tx_source, ir_vec);

%接收信号信噪比
SNR=sl_db-nv_db;

%信道输出
y=awgn(tx_sig,SNR);
adj_ir_vec=ir_vec;
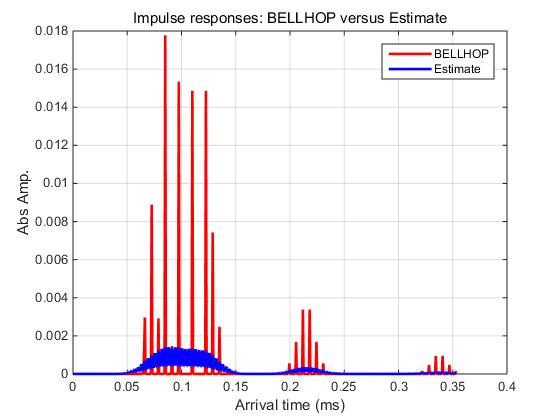
(4)得到经调整后的冲激响应
%Step 3: 经调整后的单位冲激响应
%%%%%%%%%%%%%%%%%%%%%%%%%%%%%%%%%%%%%%%%%%%%%%%%%%%%%%%%%%%%%%%%%%%%%%%%%%
est_ir_vec=signal_mf(rx_signal, tx_source, length(ir_vec));
function est_ir_vec=signal_mf(rx_signal, tx_source, cir_length)

ttl_samples=length(tx_source);

%generate matched-filter from the source signal
txsig_flip=conj(tx_source(end:-1:1));

%matched-filtering
%division by ttl_samples is necessary for normalization
est_ir_vec=conv(txsig_flip, rx_signal)/ttl_samples;
est_ir_vec=est
(5)绘制采样和经调整后的冲激响应
x_vec=(0: length(ir_vec)-1)/sampling_rate*1000;
x_vec2=(0: length(est_ir_vec)-1)/sampling_rate*1000;

figure(1),
plot(x_vec, abs(adj_ir_vec), 'r-', x_vec2, abs(est_ir_vec), 'b-', 'Linewidth', 2); grid on; hold on;
xlabel('Arrival time (ms)')
ylabel('Abs Amp.');
legend('BELLHOP', 'Estimate')
title('Impulse responses: BELLHOP versus Estimate');
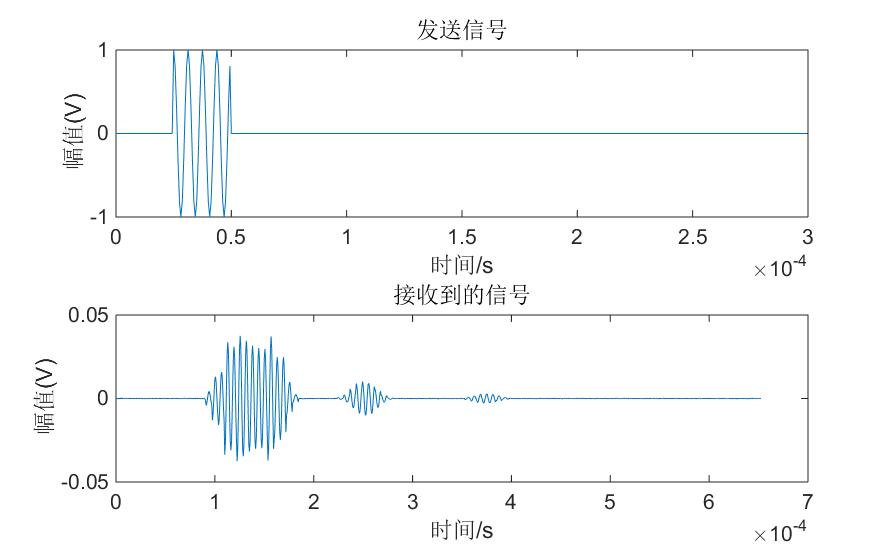
(6)绘制发送和接收信号
Ts=1/sampling_rate;

t2=0:Ts:(length(rx_signal)-1)*Ts;

figure(3)
subplot(2,1,1)
plot(t,tx_source)
title('发送信号')
xlabel('时间/s')
ylabel('幅值(V)')
set(gca, 'Fontsize', 16);

subplot(2,1,2)
plot(t2,rx_signal)

title('接收到的信号')
xlabel('时间/s')
ylabel('幅值(V)')
set(gca, 'Fontsize', 16);