import matplotlib.pyplot as plt
import pandas as pd
import numpy as np
from datetime import datetime,timedelta,date
from matplotlib.pyplot import plot
from matplotlib.font_manager import FontProperties
from openpyxl.drawing.image import Image
dpath='/Users/kangyongqing/Downloads/专项课.xlsx'
outpath='/Users/kangyongqing/Downloads/'
dt=pd.read_excel(dpath,dtype={'时间':'datetime64'})
# dt['时间']=dt['时间'].astype('datetime64')
print(dt.head(1).T)
# print(dt.shape)
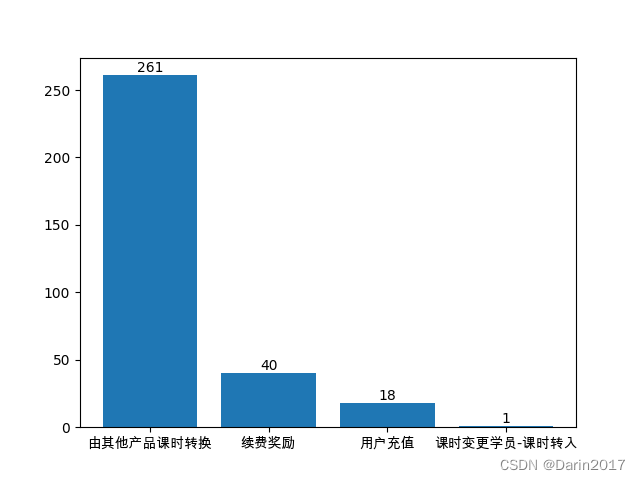
pvt_source=dt.pivot_table(index='来源',values='学生id',aggfunc='count').sort_values(['学生id'],ascending=0)
pvt_course=dt.pivot_table(index='产品名称',values='学生id',aggfunc=lambda x:len(x.unique()),fill_value=0).sort_values(['学生id'],ascending=0)
print(pvt_source)
print(pvt_course)
writer=pd.ExcelWriter(outpath+'outfile.xlsx',engine='openpyxl')
pvt_source.to_excel(writer,sheet_name='来源汇总')
pvt_course.to_excel(writer,sheet_name='课程汇总')
dt['家长id']=dt['家长id'].astype(np.int64).astype(str)
dt['学生id']=dt['学生id'].astype(np.int64).astype(str)
#长id显示为科学计数法的解决途径
dt.to_excel(writer,sheet_name='报名明细',index=False)
# writer.save()
# to_excel会自动保存,不需要writer.save(),否则会报错
# dt['sevendaybefore']=dt['时间']-timedelta(7)
# print(dt.head(2).T)
# sevenb=date.today()-timedelta(7)
# print(sevenb)
font=FontProperties(fname='/System/Library/Fonts/Supplemental/Arial Unicode.ttf',size=10)
figure1=plt.figure()
p1=plt.bar(pvt_source.index,pvt_source['学生id'])
plt.xticks(pvt_source.index,fontproperties=font)
plt.bar_label(p1,labels=pvt_source['学生id'],padding=0.2)
plt.savefig(outpath+'laiyuan.png')
plt.close()
img1=Image(outpath+'laiyuan.png')
p2=plt.bar(pvt_course.index,pvt_course['学生id'])
plt.xticks(pvt_course.index,fontproperties=font)
plt.bar_label(p2,labels=pvt_course['学生id'],padding=0.2)
plt.savefig(outpath+'course.png')
img2=Image(outpath+'course.png')
# writer.book.create_sheet('nihao')
writer.sheets['来源汇总'].add_image(img1,'E1')
writer.sheets['课程汇总'].add_image(img2,'E1')
writer.save()
# plt.show()
 涉及以下知识点:
- 数据导入时候时间格式的转换(str转为datetime)
- 透视表排序
- 创建新的excel并保存透视表数据
- 制作透视图
- 透视图显示中文标签,字体的处理办法
- 透视图插入excel表格中
- 长id科学计数法显示的处理
- 注意:to_excel会自动保存,不要重复写,否则会报错