Prometheus
homebrew安装prometheus:
brew install prometheus
默认配置文件prometheus.yml
global:
  scrape_interval: 15s

scrape_configs:
  - job_name: "prometheus"
    static_configs:
    - targets: ["localhost:9090"]
指定配置文件,运行 prometheus :
prometheus --config.file=/usr/local/etc/prometheus.yml打开localhost:9090就可以看到prometheus的监控页面了:

GrafanaNode exporter
Grafana是一款美观强大的开源监控指标可视化展示框架,操作简单,视觉酷炫!
homebrew安装Grafana:
$ brew install grafana
启动:
$ brew services start grafana
启动后,打开localhost:3000就可以看到Grafana界面了。首先是一个登录页面,默认用户名和密码都是admin。登录,修改用户名密码
添加数据源,顾名思义,需要展示的数据从哪里来,Prometheus啊,加上这个数据源,如下图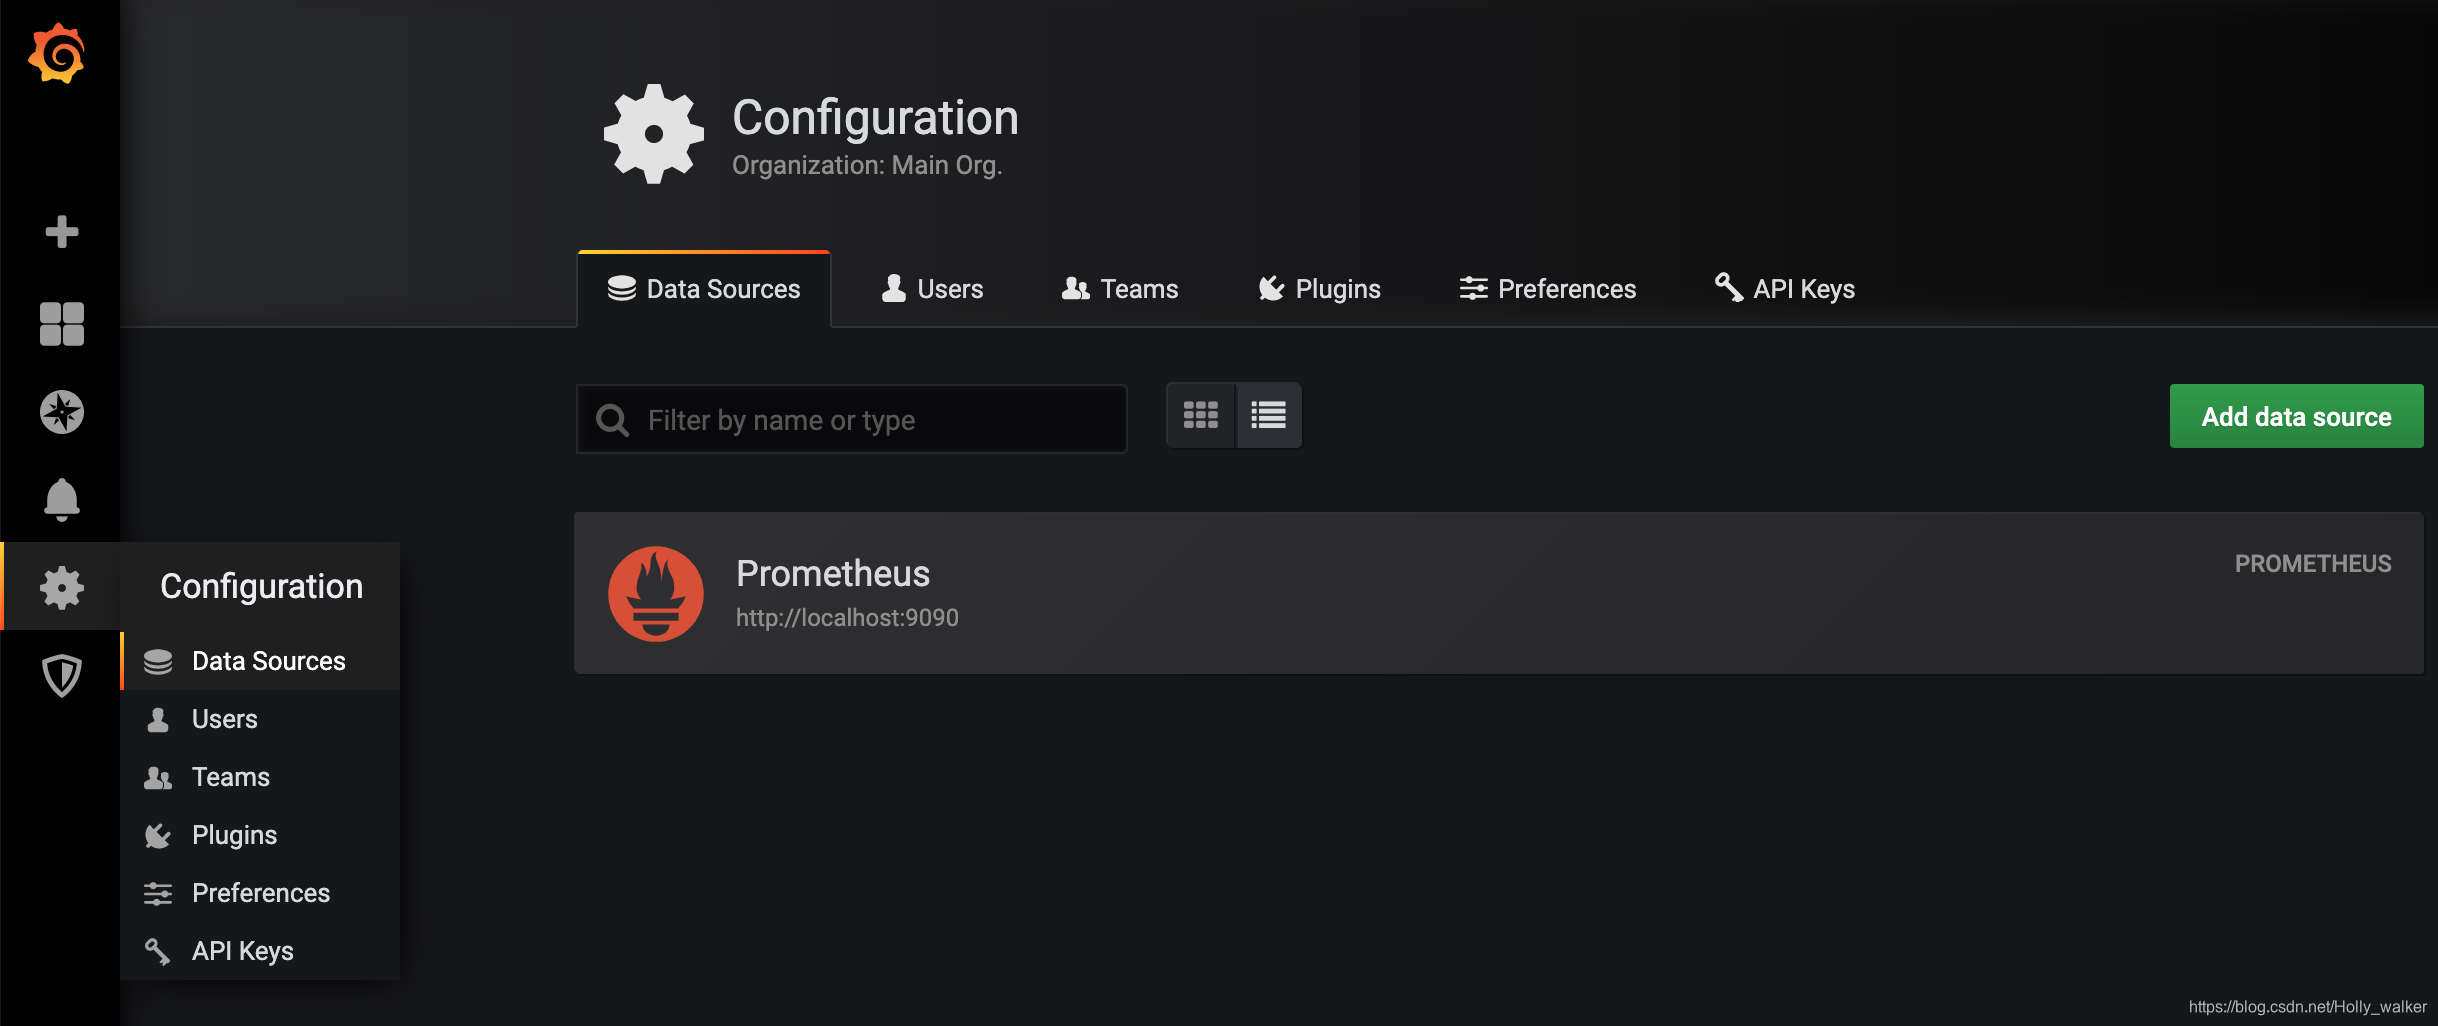
后续操作就更简单了,Add panel添加新的仪表盘监控,Add Query写入Prometheus的SQL,数据就展示出来了。
其他的功能,比如添加文件夹分组啊、改panel title啊、import JSON file啊之类的多点一点就会了
安装Node exporter
brew install node_exporter

运行
node_exporter
为了能够让Prometheus Server能够从当前node exporter获取到监控数据,这里需要修改Prometheus配置文件。编辑prometheus.yml并在scrape_configs节点下添加以下内容:
global:
  scrape_interval: 15s

scrape_configs:
  - job_name: "prometheus"
    static_configs:
    - targets: ["localhost:9090"]

  #采集node exporter监控数据
  - job_name: "node_exporter"
    static_configs:
    - targets: ["localhost:9100"]
import JSON file功能不错,在Grafana中你的数据展示设置和配置是以JSON文件的格式保存的,import JSON file可以支持上传和下载JSON文件,Grafana官网 https://grafana.com/grafana/dashboards有很丰富的Dashboards供你选择,免去了自己一步一步把监控都建出来的烦恼。搜索到想要的Dashboard后,输入id号就OK了,如下图


