代码
# -*- coding: utf-8 -*-
import torch
import numpy
from matplotlib import pyplot
from torch import nn
from torch.nn import functional as F
from torch import optim
import torchvision
from torchvision import transforms as TT
# 框架信息
print("torch.__version__=",torch.__version__)
print("torch.cuda.is_available()=",torch.cuda.is_available())
print()
# 绘制曲线
def plot_curve(data):
fig=pyplot.figure()
pyplot.plot(range(len(data)),data,color='blue')
pyplot.legend(["value"],loc="upper right")
pyplot.xlabel("step")
pyplot.ylabel("value")
pyplot.show()
# 识别结果
def plot_image(img,label,name):
fig=pyplot.figure()
for i in range(6):
pyplot.subplot(2,3,i+1)
pyplot.tight_layout()
pyplot.imshow(img[i][0]*0.3081+0.1307,cmap="gray",interpolation="none")
pyplot.title("{}:{}".format(name,label[i].item()))
pyplot.xticks([])
pyplot.yticks([])
pyplot.show()
def one_hot(label,depth=10):
out=torch.zeros(label.size(0),depth)
idx=torch.LongTensor(label).view(-1,1)
out.scatter_(dim=1,index=idx,value=1)
return out
batch_size=512
# step1. load dataset
# 训练集【本地没有的话会联网下载】,shuffle=True打乱
train_loader=torch.utils.data.DataLoader(
torchvision.datasets.MNIST("mnist_data",train=True,download=True,
transform=TT.Compose([
TT.ToTensor(),
TT.Normalize(
(0.1307,),(0.3081,)
)
])
),
batch_size=batch_size,shuffle=True)
# 测试集【本地没有的话会联网下载】shuffle=False不需要打乱
test_loader=torch.utils.data.DataLoader(
torchvision.datasets.MNIST("mnist_data/",train=False,download=True,
transform=TT.Compose([
TT.ToTensor(),
TT.Normalize(
(0.1307,),(0.3081,)
)
])
),
batch_size=batch_size,shuffle=False)
x,y=next(iter(train_loader))
print("x.shape=",x.shape,"y.shape=",y.shape)
print("x.min()=",x.min(),"y.min()=",y.min())
print("x.max()=",x.max(),"y.max()=",y.max())
print()
# 显示一下
plot_image(x,y,"image sample")
# 自定义模型
class Net(nn.Module):
# 构造函数
def __init__(self):
super(Net,self).__init__()
# 3层 wx+b
self.fc1=nn.Linear(28*28,512)
self.fc2=nn.Linear(512,256)
self.fc3=nn.Linear(256,128)
self.fc4=nn.Linear(128,64)
self.fc5=nn.Linear(64,32)
self.fc6=nn.Linear(32,16)
self.fc7=nn.Linear(16,10)
# 前向求函数值
def forward(self,x):
x=F.relu(self.fc1(x))
x=F.relu(self.fc2(x))
x=F.relu(self.fc3(x))
x=F.relu(self.fc4(x))
x=F.relu(self.fc5(x))
x=F.relu(self.fc6(x))
x=self.fc7(x)
return x
net=Net()
# [w1,b1,w2,b2,w3,b3]
optimizer=optim.SGD(net.parameters(),lr=0.001,momentum=0.9)
train_loss=[]
# 循环迭代n次
n=5000
for epoch in range(n):
for batch_idx,(x,y) in enumerate(train_loader):
# x:[b,1,28,28] y:[512]
x=x.view(x.size(0),28*28)
# =>[b,10]
out=net(x)
# [b,10]
y_onehot=one_hot(y,10)
# loss=mse(out,y_onehot)
loss=F.mse_loss(out,y_onehot)
optimizer.zero_grad()
loss.backward()
# w'=w-lr*grad
optimizer.step()
# 把损失值记录起来
train_loss.append(loss.item())
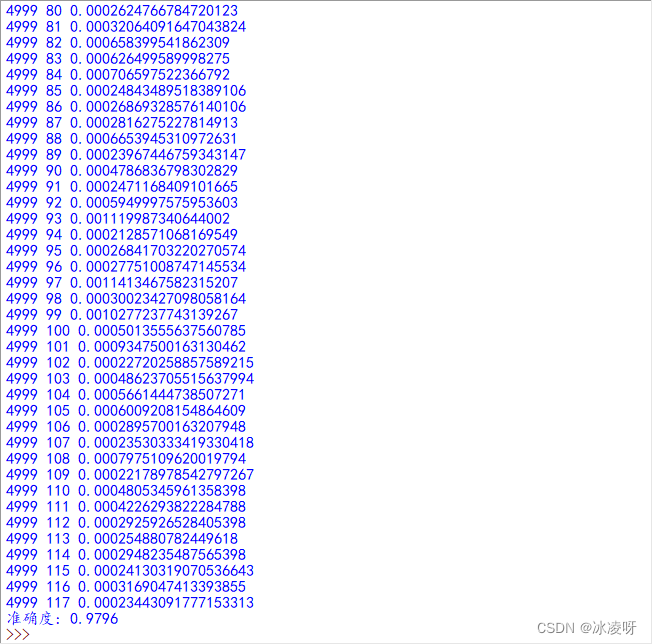
print(epoch,batch_idx,loss.item())
# 打印损失函数在训练中的走势
plot_curve(train_loss)
# we get optimal [w1,b1,w2,b2,w3,b3]
total_correct=0
for x,y in test_loader:
x=x.view(x.size(0),28*28)
out=net(x)
# out:[b,10]=>pred:[b]
pred=out.argmax(dim=1)
correct=pred.eq(y).sum().float().item()
total_correct+=correct
total_num=len(test_loader.dataset)
acc=total_correct/total_num
print("准确度:",acc)
x,y=next(iter(test_loader))
out=net(x.view(x.size(0),28*28))
pred=out.argmax(dim=1)
# 显示测试结果
plot_image(x,pred,"test")
损失值训练趋势