WindowsForm应用程序中Chart图表控件所属的命名空间:
Chart
命名空间:
System.Windows.Forms.DataVisualization.Charting
对应的dll路径:
C:\Program Files (x86)\Reference Assemblies\Microsoft\Framework\.NETFramework\v4.6.1\System.Windows.Forms.DataVisualization.dll
示例:我们使用chart来统计某种产品的OK和NG个数。
每隔5秒钟自动刷新OK和NG数量,可以切换使用柱状图、环形、线性图、饼图等显示
新建windows窗体应用程序:
ChartDemo,将默认的Form1,重命名为FormChart,
窗体设计器源程序如下:
文件:FormChart.Designer.cs
namespace ChartDemo
{
    partial class FormChart
    {
        /// <summary>
        /// 必需的设计器变量。
        /// </summary>
        private System.ComponentModel.IContainer components = null;

        /// <summary>
        /// 清理所有正在使用的资源。
        /// </summary>
        /// <param name="disposing">如果应释放托管资源,为 true;否则为 false。</param>
        protected override void Dispose(bool disposing)
        {
            if (disposing && (components != null))
            {
                components.Dispose();
            }
            base.Dispose(disposing);
        }

        #region Windows 窗体设计器生成的代码

        /// <summary>
        /// 设计器支持所需的方法 - 不要修改
        /// 使用代码编辑器修改此方法的内容。
        /// </summary>
        private void InitializeComponent()
        {
            System.Windows.Forms.DataVisualization.Charting.ChartArea chartArea1 = new System.Windows.Forms.DataVisualization.Charting.ChartArea();
            System.Windows.Forms.DataVisualization.Charting.Legend legend1 = new System.Windows.Forms.DataVisualization.Charting.Legend();
            System.Windows.Forms.DataVisualization.Charting.Series series1 = new System.Windows.Forms.DataVisualization.Charting.Series();
            this.chart1 = new System.Windows.Forms.DataVisualization.Charting.Chart();
            this.label1 = new System.Windows.Forms.Label();
            this.cboChartType = new System.Windows.Forms.ComboBox();
            this.label2 = new System.Windows.Forms.Label();
            this.label3 = new System.Windows.Forms.Label();
            this.label4 = new System.Windows.Forms.Label();
            this.lblOKCount = new System.Windows.Forms.Label();
            this.lblNGCount = new System.Windows.Forms.Label();
            this.lblTotalCount = new System.Windows.Forms.Label();
            ((System.ComponentModel.ISupportInitialize)(this.chart1)).BeginInit();
            this.SuspendLayout();
            //
            // chart1
            //
            chartArea1.Name = "ChartArea1";
            this.chart1.ChartAreas.Add(chartArea1);
            legend1.Name = "Legend1";
            this.chart1.Legends.Add(legend1);
            this.chart1.Location = new System.Drawing.Point(22, 68);
            this.chart1.Name = "chart1";
            series1.ChartArea = "ChartArea1";
            series1.Legend = "Legend1";
            series1.Name = "产量";
            this.chart1.Series.Add(series1);
            this.chart1.Size = new System.Drawing.Size(652, 559);
            this.chart1.TabIndex = 0;
            this.chart1.Text = "chart1";
            //
            // label1
            //
            this.label1.AutoSize = true;
            this.label1.Font = new System.Drawing.Font("宋体", 16F);
            this.label1.Location = new System.Drawing.Point(19, 21);
            this.label1.Name = "label1";
            this.label1.Size = new System.Drawing.Size(98, 22);
            this.label1.TabIndex = 1;
            this.label1.Text = "图表类型";
            //
            // cboChartType
            //
            this.cboChartType.Font = new System.Drawing.Font("宋体", 16F);
            this.cboChartType.FormattingEnabled = true;
            this.cboChartType.Location = new System.Drawing.Point(123, 18);
            this.cboChartType.Name = "cboChartType";
            this.cboChartType.Size = new System.Drawing.Size(214, 29);
            this.cboChartType.TabIndex = 2;
            this.cboChartType.SelectedIndexChanged += new System.EventHandler(this.cboChartType_SelectedIndexChanged);
            //
            // label2
            //
            this.label2.AutoSize = true;
            this.label2.Font = new System.Drawing.Font("宋体", 16F);
            this.label2.Location = new System.Drawing.Point(93, 640);
            this.label2.Name = "label2";
            this.label2.Size = new System.Drawing.Size(43, 22);
            this.label2.TabIndex = 3;
            this.label2.Text = "OK:";
            //
            // label3
            //
            this.label3.AutoSize = true;
            this.label3.Font = new System.Drawing.Font("宋体", 16F);
            this.label3.Location = new System.Drawing.Point(93, 670);
            this.label3.Name = "label3";
            this.label3.Size = new System.Drawing.Size(43, 22);
            this.label3.TabIndex = 4;
            this.label3.Text = "NG:";
            //
            // label4
            //
            this.label4.AutoSize = true;
            this.label4.Font = new System.Drawing.Font("宋体", 16F);
            this.label4.Location = new System.Drawing.Point(60, 700);
            this.label4.Name = "label4";
            this.label4.Size = new System.Drawing.Size(76, 22);
            this.label4.TabIndex = 5;
            this.label4.Text = "Total:";
            //
            // lblOKCount
            //
            this.lblOKCount.AutoSize = true;
            this.lblOKCount.Font = new System.Drawing.Font("宋体", 16F);
            this.lblOKCount.Location = new System.Drawing.Point(144, 640);
            this.lblOKCount.Name = "lblOKCount";
            this.lblOKCount.Size = new System.Drawing.Size(21, 22);
            this.lblOKCount.TabIndex = 6;
            this.lblOKCount.Text = "0";
            //
            // lblNGCount
            //
            this.lblNGCount.AutoSize = true;
            this.lblNGCount.Font = new System.Drawing.Font("宋体", 16F);
            this.lblNGCount.Location = new System.Drawing.Point(144, 670);
            this.lblNGCount.Name = "lblNGCount";
            this.lblNGCount.Size = new System.Drawing.Size(21, 22);
            this.lblNGCount.TabIndex = 7;
            this.lblNGCount.Text = "0";
            //
            // lblTotalCount
            //
            this.lblTotalCount.AutoSize = true;
            this.lblTotalCount.Font = new System.Drawing.Font("宋体", 16F);
            this.lblTotalCount.Location = new System.Drawing.Point(144, 700);
            this.lblTotalCount.Name = "lblTotalCount";
            this.lblTotalCount.Size = new System.Drawing.Size(21, 22);
            this.lblTotalCount.TabIndex = 8;
            this.lblTotalCount.Text = "0";
            //
            // FormChart
            //
            this.AutoScaleDimensions = new System.Drawing.SizeF(6F, 12F);
            this.AutoScaleMode = System.Windows.Forms.AutoScaleMode.Font;
            this.ClientSize = new System.Drawing.Size(862, 747);
            this.Controls.Add(this.lblTotalCount);
            this.Controls.Add(this.lblNGCount);
            this.Controls.Add(this.lblOKCount);
            this.Controls.Add(this.label4);
            this.Controls.Add(this.label3);
            this.Controls.Add(this.label2);
            this.Controls.Add(this.cboChartType);
            this.Controls.Add(this.label1);
            this.Controls.Add(this.chart1);
            this.Name = "FormChart";
            this.Text = "图表示例:切换图表类型";
            this.FormClosing += new System.Windows.Forms.FormClosingEventHandler(this.FormChart_FormClosing);
            this.Load += new System.EventHandler(this.FormChart_Load);
            ((System.ComponentModel.ISupportInitialize)(this.chart1)).EndInit();
            this.ResumeLayout(false);
            this.PerformLayout();

        }

        #endregion

        private System.Windows.Forms.DataVisualization.Charting.Chart chart1;
        private System.Windows.Forms.Label label1;
        private System.Windows.Forms.ComboBox cboChartType;
        private System.Windows.Forms.Label label2;
        private System.Windows.Forms.Label label3;
        private System.Windows.Forms.Label label4;
        private System.Windows.Forms.Label lblOKCount;
        private System.Windows.Forms.Label lblNGCount;
        private System.Windows.Forms.Label lblTotalCount;
    }
}
FormChart.代码如下:
文件:FormChart.cs
using System;
using System.Collections.Generic;
using System.ComponentModel;
using System.Data;
using System.Drawing;
using System.Linq;
using System.Text;
using System.Threading;
using System.Threading.Tasks;
using System.Windows.Forms;

namespace ChartDemo
{
    public partial class FormChart : Form
    {
        /// <summary>
        /// 是否运行线程
        /// </summary>
        public static bool isRun = false;
        public FormChart()
        {
            InitializeComponent();
            //添加不同的图表枚举
            cboChartType.Items.AddRange(new object[] {
            "Spline",
            "Pie",
            "Column",
            "Doughnut"});
            cboChartType.SelectedIndex = 3;
        }

        /// <summary>
        /// 切换图表类型
        /// </summary>
        /// <param name="sender"></param>
        /// <param name="e"></param>
        private void cboChartType_SelectedIndexChanged(object sender, EventArgs e)
        {
            if (cboChartType.SelectedIndex == -1)
            {
                return;
            }
            System.Windows.Forms.DataVisualization.Charting.SeriesChartType chartType;
            Enum.TryParse(cboChartType.Text, true, out chartType);
            chart1.Series[0].ChartType = chartType;
        }

        private void FormChart_Load(object sender, EventArgs e)
        {
            isRun = true;
            Task.Factory.StartNew(() =>
            {
                while (isRun)
                {
                    Tuple<int, int, int> tuple = GetProductCount();
                    RefreshChart(tuple);
                    Thread.Sleep(5000);
                }
            });
        }

        /// <summary>
        /// 返回指定时间区间的OK数量、NG数量、总数量
        /// </summary>
        /// <returns></returns>
        private Tuple<int, int, int> GetProductCount()
        {
            int okCount = 0;
            int ngCount = 0;
            okCount = new Random().Next(1000, 10000);
            ngCount = new Random(Guid.NewGuid().GetHashCode()).Next(1000, 10000);
            return Tuple.Create(okCount, ngCount, okCount + ngCount);
        }

        /// <summary>
        /// 刷新图表
        /// </summary>
        /// <param name="tuple"></param>
        void RefreshChart(Tuple<int, int, int> tuple)
        {
            List<Tuple<string, int>> dataList = new List<Tuple<string, int>>
            {
                Tuple.Create("OK", tuple.Item1),
                Tuple.Create("NG", tuple.Item2),
            };
            this.BeginInvoke(new Action(() =>
            {
                try
                {
                    if (!this.IsHandleCreated)
                    {
                        return;
                    }
                    lblOKCount.Text = tuple.Item1.ToString();
                    lblNGCount.Text = tuple.Item2.ToString();
                    lblTotalCount.Text = tuple.Item3.ToString();
                    chart1.Series[0].Points.Clear();
                    for (int i = 0; i < dataList.Count; i++)
                    {
                        //chart的X轴为索引,Y轴为实际值
                        chart1.Series[0].Points.AddXY(dataList[i].Item1, dataList[i].Item2);
                    }
                    chart1.ChartAreas[0].AxisX.MajorGrid.Enabled = false;//隐藏X网格线
                    chart1.ChartAreas[0].AxisY.MajorGrid.Enabled = false;//隐藏Y网格线
                    chart1.Series[0].IsValueShownAsLabel = true; //显示Y轴的具体值
                    //传入相等数量的集合:甜甜圈
                    System.Windows.Forms.DataVisualization.Charting.SeriesChartType chartType;
                    Enum.TryParse(cboChartType.Text, true, out chartType);
                    chart1.Series[0].ChartType = chartType;
                    //chart1.Series[0].ChartType = System.Windows.Forms.DataVisualization.Charting.SeriesChartType.Doughnut;
                    chart1.Series[0].Points[0].Color = Color.ForestGreen;//第一个柱状图OK显示绿色
                    chart1.Series[0].Points[1].Color = Color.Red;//第二个柱状图NG显示红色
                    chart1.Series[0].MarkerStyle = System.Windows.Forms.DataVisualization.Charting.MarkerStyle.Circle;
                }
                catch (Exception ex)
                {
                    MessageBox.Show($"RefreshChart Occur Exception:{ex.Message}");
                }
            }));
        }

        /// <summary>
        /// 窗体正在关闭事件,关闭线程
        /// </summary>
        /// <param name="sender"></param>
        /// <param name="e"></param>
        private void FormChart_FormClosing(object sender, FormClosingEventArgs e)
        {
            isRun = false;
        }
    }
}
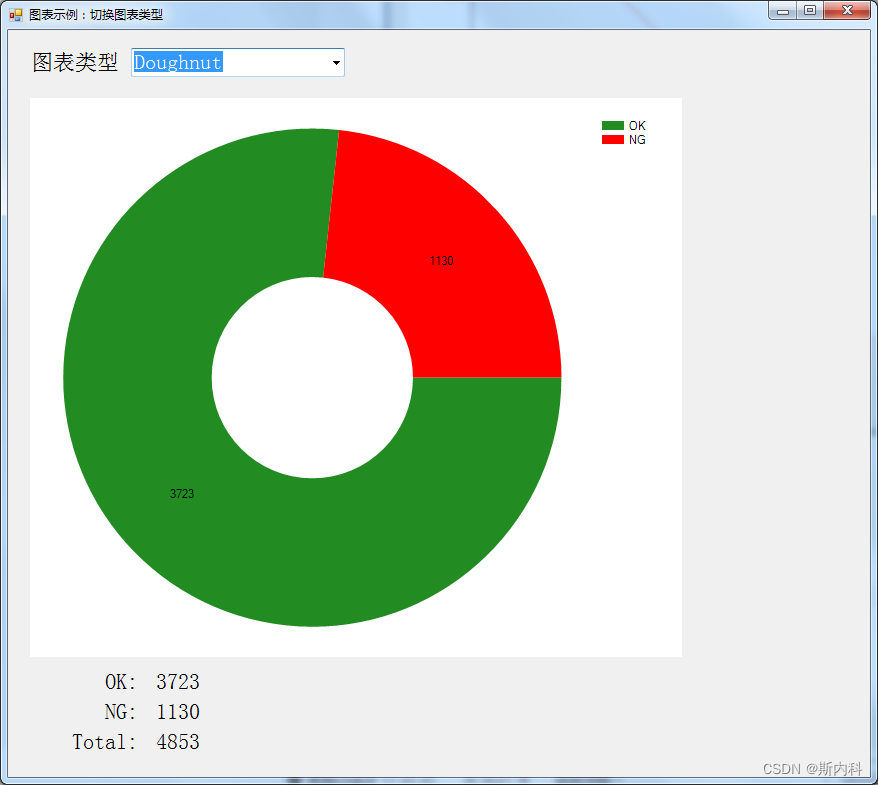
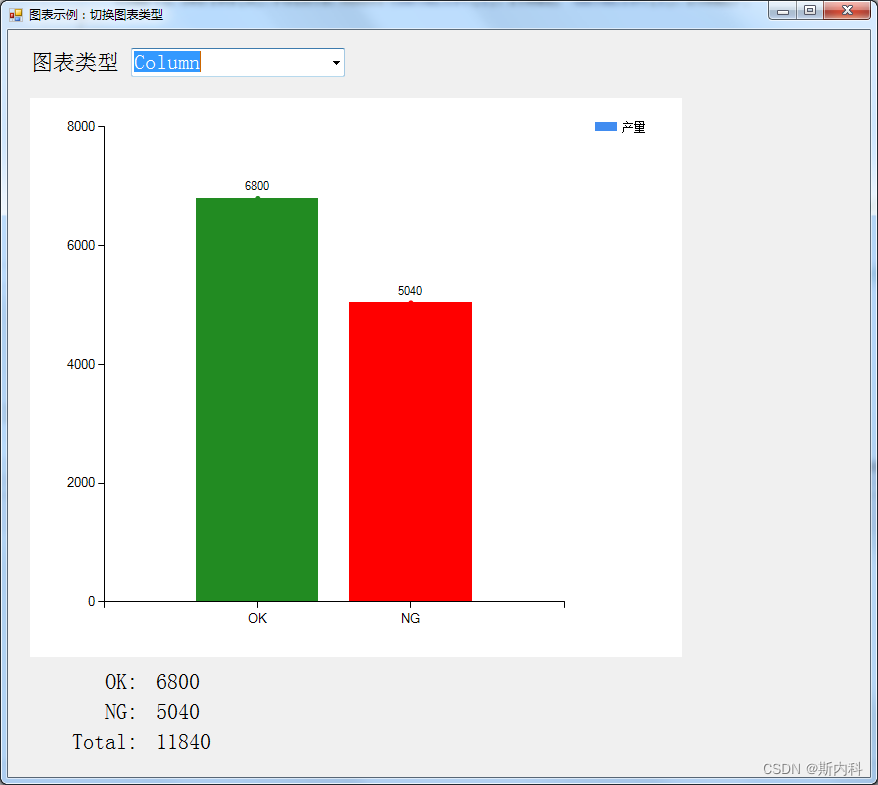
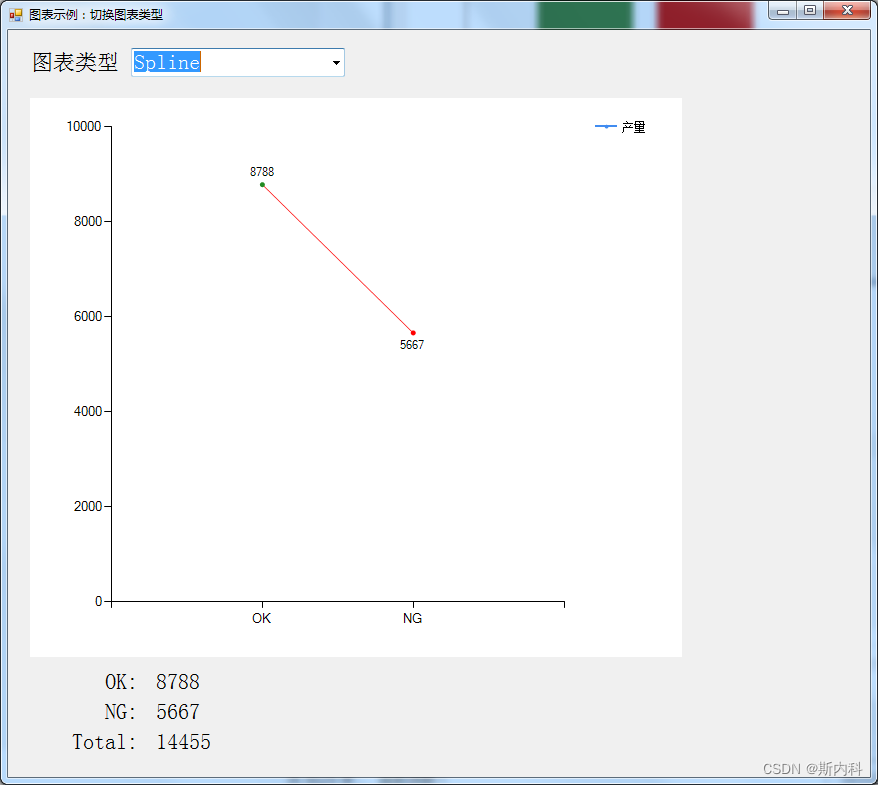
运行如图:
①柱状图:
②线性图:
③环形图【甜甜圈】