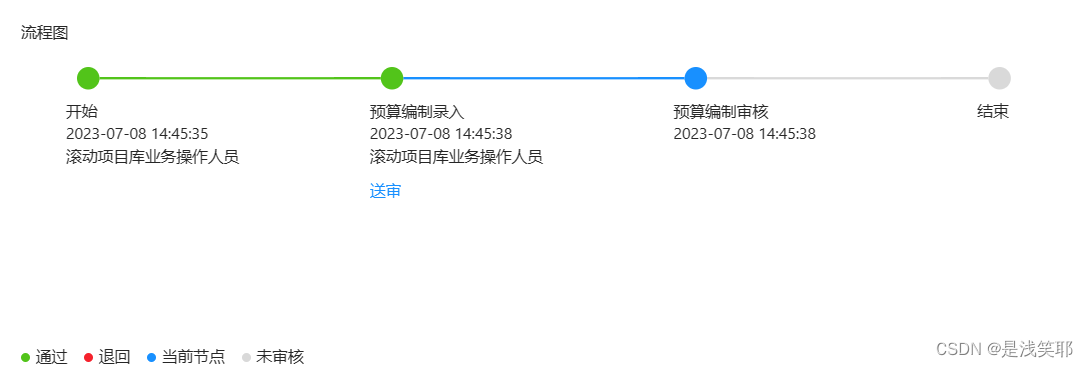
先放效果图:
1.安装dagre-d3和d3:
npm install d3
npm install dagre-d3
2.在组件中导入并使用d3和dagre-d3:
<script>
    import * as d3 from 'd3';
    import dagreD3 from 'dagre-d3';
</script>
3.在模板中创建节点元素:
<template>
    <div class="top_model">
        <div class="flow_chart" ref="flowchartContainer"></div>
    </div>
</template>
4.在setup中定义所需数据:
setup()  {
    //创建一个ref引用对象,它用于引用以上绑定ref为flowchartContainer的DOM元素
    const flowchartContainer = ref(null);
    const taskLogData = reactive({
        dataSource: [] as any,
        //流程图数据
        list: {
          nodeInfos: [] as any,
          edges: [] as any,
        },
    })
}
5.进行绘制:
//mounted生命周期钩子函数是在组件实例挂载到 DOM 后调用的,
//在这个时候可以获取到组件的根元素,并且可以执行相应的操作
//因此将绘制代码放在这里执行
onMounted(async () => {
    //调用了接口getListData,需要从其中取出数据,因此需要执行异步方法async/await
    await getListData();
    //nextTick函数确保了在DOM更新之后再执行相应的操作,
    //避免了由于异步更新导致的状态不一致问题
    nextTick(() => {
        //使用dagreD3库来创建一个有向无环图的图形
        var g = new dagreD3.graphlib.Graph().setGraph({
          rankdir: 'LR', // 指定布局方向为从左到右
          nodesep: 200, // 设置节点间距
          ranksep: 250, //垂直间距
        });
        //添加节点
        taskLogData.list.nodeInfos.forEach(
          (
            item: {
              id: string;
              label: any;
              tooltip: any;
              tipone: any;
              tiptow: any;
              tipthree: any;
              color: any;
            },
            index: any,
          ) => {
            //设置图形中指定节点的属性
            g.setNode(item.id, {
              label: item.label,//节点内容
              //自定义属性,调整样式使其成为节点备注
              tooltip: item.tooltip,//节点备注(对应图片中的节点下的名称,开始-结束)
              tipone: item.tipone,//节点备注1(对应图片中的时间)
              tiptow: item.tiptow,//节点备注2(对应图片中的操作人员)
              tipthree: item.tipthree,//节点备注3(对应图片中的蓝色备注)
              style: `fill: ${item.color}`,//节点填充颜色,item.color为变量
              shape: 'circle',//节点形状设置为圆形
              class: 'node',//设置节点类名
              rank: 0, // 设置节点的rank属性为0,表示在同一水平排列
            });
          },
        );
        //添加节点关系
        taskLogData.list.edges.forEach(
          (item: { source: string; target: string; edgeColor: string }) => {
            //创建并设置图形中两个节点之间的边(Edge)
            g.setEdge(item.source, item.target, {
              // 设置边的样式
              style: 'stroke: ' + item.edgeColor + ';
              fill: none; stroke-width: 2px;',
              arrowheadStyle: 'fill: none;', // 设置箭头样式为无箭头
            });
          },
        );
        //创建一个SVG元素作为绘图容器,
        //并将其添加到flowchartContainer.value所引用的DOM元素中
        const svg = d3
          .select(flowchartContainer.value)
          //在选定的DOM元素内添加一个SVG元素
          .append('svg')
          //设置SVG元素的宽度与高度属性
          .attr('width', '')
          .attr('height', 240);
        // 创建渲染器
        const render = new dagreD3.render();
        // 执行渲染
        render(svg as any, g as any);
        // 添加节点备注
        //获取并遍历类名为node的元素
        svg.selectAll('.node').each((nodeId, index) => {
          // 获取节点的备注信息
          const tooltipText = g.node(nodeId as any).tooltip;
          const tipone = g.node(nodeId as any).tipone;
          const tiptow = g.node(nodeId as any).tiptow;
          const tipthree = g.node(nodeId as any).tipthree;
          //获取节点对象
          const node = d3.select(flowchartContainer.value);
          // 获取元素的位置
          const bbox = g.node(nodeId as any);
          // 在节点下方添加备注文本
          const remarkText = (node as any)
            .append('text')
            .attr('class', 'node-remark')
            .text(tooltipText);
          const remarkTextone = (node as any)
            .append('text')
            .attr('class', 'node-remark')
            .text(tipone);
          const remarkTexttow = (node as any)
            .append('text')
            .attr('class', 'node-remark')
            .text(tiptow);
          const remarkTextthree = (node as any)
            .append('text')
            .attr('class', 'node-remark')
            .text(tipthree)
            .attr('class', 'remarkLast')
            .attr('id', 'remarkLast' + nodeId);
          //添加气泡弹窗
          const remarkTextFour = (node as any)
            .append('div')
            .attr('class', 'remarkFlow')
            .attr('id', 'remarkFlow' + nodeId)
            .text(tipthree);
          // 调整备注位置
          remarkText
            .style('position', 'absolute')
            .style('top', `${bbox.y + 60}px`)
            .style('left', `${bbox.x + 30}px`);
          remarkTextone
            .style('position', 'absolute')
            .style('top', `${bbox.y + 80}px`)
            .style('left', `${bbox.x + 30}px`);
          remarkTexttow
            .style('position', 'absolute')
            .style('top', `${bbox.y + 100}px`)
            .style('max-width', '130px')
            .style('left', `${bbox.x + 30}px`);
          remarkTextthree
            .style('position', 'absolute')
            .style('top', `${bbox.y + 130}px`)
            .style('left', `${bbox.x + 30}px`);
          remarkTextFour
            .style('position', 'absolute')
            .style('top', `${bbox.y + 60}px`)
            .style('left', `${bbox.x + 30}px`);
          //鼠标悬停效果
          (document.getElementById('remarkLast' + nodeId) as any).onmouseover
            = function () {
               (document.getElementById('remarkFlow' + nodeId) as any)
               .style.display = 'block';
           };
          (document.getElementById('remarkLast' + nodeId) as any).onmouseout
            = function () {
                (document.getElementById('remarkFlow' + nodeId) as any)
                .style.display = 'none';
           };
        });
      });
});
6.对接口数据进行处理:
// 获取流程图数据
    const getListData = async () => {
      const res: any = await getTaskLogs();
      console.log('res', res);
      if (res.status_code == '0000') {
        const nodeList= res.data;
        // 打印数组中的节点
        console.log('节点:', nodeList);
        for (var i = 0; i < nodeList.length; i++) {
          //默认节点连线颜色为绿色
          let edgeColor = '#52c41a';
          //当前节点之后的节点都设为灰色
          for (var j = i - 1; j > 0; j--) {
            if (nodeList[j].isCurNode == true) {
              taskLogData.list.nodeInfos[i].color = '#d9d9d9';
              edgeColor = '#d9d9d9';
            }
          }
          //当前节点设为蓝色
          if (nodeList[i].isCurNode == true) {
            taskLogData.list.nodeInfos[i].color = '#1890ff';
            edgeColor = '#1890ff';
          }
          //节点之间的连线
          if (i > 0) {
            taskLogData.list.edges.push({
              source: nodeList[i - 1].nodeId,
              target: nodeList[i].nodeId,
              edgeColor: edgeColor,
              style: 'stroke-solid',
            });
          }
        }
      } else {
        message.error(res.reason);
      }
    };