- D3的简介
D3 全名为 Data Drive Document,即通过 Data 操作 Document,而在做数据可视化时,Data 最常 Drive 的 Document 便是 SVG。刚了解到D3时,看到D3官网非常丰富且酷炫的Demo,便觉得 D3 应该有着无限可能的图形开发能力,所以在学习完基础的API和SVG的基础后,就开始着手绘制D3的节点拓扑图了; - 绘制简易的可拖拽节点拓扑图
2.1 准备工作:
- 安装D3:
npm install d3 --save
- 项目中导入D3:
import * as d3 from "d3"
- 准备模拟好的节点数据options并导入:
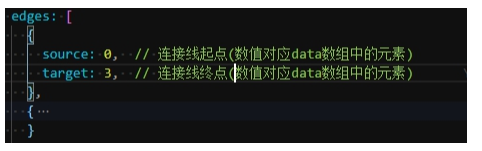
options对象含两个属性data和edges;data保存节点信息,edges保存节点之间的关系
data:

edges:
2.2 开始绘制
1.在html结构中准备好svg画布
<template>
  <div >
    <svg id="togo" width="1800" height="700" />
  </div>
</template>
- 在mounted生命周期中:
1)先定义好准备使用的常量
const fontSize = 10;
const symbolSize = 40;
const padding = 10;
const that = this
2)我们定义一个名为Topo的类,将所有关于拓扑图绘制的方法和属性都写在其中
class Topo {
      constructor(svg, option) {
        this.data = option.data;
        this.edges = option.edges;
        this.svg = d3.select(svg);
      }

      //初始化节点位置
      initPosition () {
        let width = this.svg.attr('width');
        let height = this.svg.attr('height');
        let points = this.getVertices(this.data.length);
        this.data.forEach((item, i) => {
          item.x = points[i].x + width / 4;
          item.y = points[i].y + height / 9;
        })
      }

      //根据节点的个数,生成矩形阵列(即配置节点的摆放位置),返回的points为节点的定位坐标[{x:..,y:...},...]
      getVertices (n) {
        if (typeof n !== 'number') return;
        var i = 0;
        var j = 0;
        var k = 0
        var points = [];
        while (k < n) {
          points.push({
            x: 100 + 300 * i,
            y: 100 + 300 * j,
          });
          if (i < 2) {
            i++;
          } else {
            i = 0
            j++
          }
          k++
        }
        return points;
      }

      // 计算两点的中心点(用于确认摆放在连接线上的文字的位置)
      getCenter (x1, y1, x2, y2) {
        return [(x1 + x2) / 2, (y1 + y2) / 2]
      }

      // 计算两点角度
      getAngle (x1, y1, x2, y2) {
        var x = Math.abs(x1 - x2);
        var y = Math.abs(y1 - y2);
        var z = Math.sqrt(x * x + y * y);
        return Math.round((Math.asin(y / z) / Math.PI * 180));
      }

      // 初始化缩放器
      initZoom () {
        let self = this;
        let zoom = d3.zoom()
          .scaleExtent([0.7, 3])
          .on('zoom', function () {
            self.onZoom(this)
          });
        this.svg.call(zoom)
      }

      // 初始化图标库
      initDefineSymbol () {
        // defs用于预定义一个元素使其能够在SVG图像中重复使用,我们defs标签中的g元素必须在<g>元素上设置一个ID,通过ID来引用它。
        let defs = this.container.append('svg:defs');
        // 向defs中添加箭头图标
        defs
          .selectAll('marker')
          .data(this.edges)
          .enter()
          .append('svg:marker')
          .attr('id', (link, i) => 'marker-' + i)
          .attr('markerUnits', 'userSpaceOnUse')
          .attr('viewBox', '0 -5 10 10')
          .attr('refX', symbolSize / 2 + padding * 1.5)
          .attr('refY', 0)
          .attr('markerWidth', 14)
          .attr('markerHeight', 14)
          .attr('orient', 'auto')
          .attr('stroke-width', 2)
          .append('svg:path')
          .attr('d', 'M2,0 L0,-3 L9,0 L0,3 M2,0 L0,-3')
          .attr('class', 'arrow')

        // 向defs中添加数据库图标
        defs.append('g')
          .attr('id', 'database')
          .attr('transform', 'scale(0.042)').append('path')
          .attr('d', 'M512 800c-247.42 0-448-71.63-448-160v160c0 88.37 200.58 160 448 160s448-71.63 448-160V640c0 88.37-200.58 160-448 160z M512 608c-247.42 0-448-71.63-448-160v160c0 88.37 200.58 160 448 160s448-71.63 448-160V448c0 88.37-200.58 160-448 160z M512 416c-247.42 0-448-71.63-448-160v160c0 88.37 200.58 160 448 160s448-71.63 448-160V256c0 88.37-200.58 160-448 160z M64 224a448 160 0 1 0 896 0 448 160 0 1 0-896 0Z')
          .attr('style', "fill:#297aff")

        // 向defs中添加云图标
        defs.append('g')
          .attr('id', 'cloud')
          .attr('transform', 'scale(0.042)')
          .append('path')
          .attr('d', 'M709.3 285.8C668.3 202.7 583 145.4 484 145.4c-132.6 0-241 102.8-250.4 233-97.5 27.8-168.5 113-168.5 213.8 0 118.9 98.8 216.6 223.4 223.4h418.9c138.7 0 251.3-118.8 251.3-265.3 0-141.2-110.3-256.2-249.4-264.5z')

        // 向defs中添加应用图标
        defs.append('g')
          .attr('id', 'myapp')
          .attr('transform', 'scale(0.042)')
          .append('path')
          .attr('d', 'M544 552.325V800a32 32 0 0 1-32 32 31.375 31.375 0 0 1-32-32V552.325L256 423.037a32 32 0 0 1-11.525-43.512A31.363 31.363 0 0 1 288 368l224 128 222.075-128a31.363 31.363 0 0 1 43.525 11.525 31.988 31.988 0 0 1-11.525 43.513L544 551.038z m0 0,M64 256v512l448 256 448-256V256L512 0z m832 480L512 960 128 736V288L512 64l384 224z m0 0')

        // 向defs中添加地球图标
        let earth = defs.append('g')
          .attr('id', "earth")
          .attr('transform', 'scale(0.042)');
        earth.append("path")
          .attr("d", 'm 973.70505,457.95556 c -9.82626,-86.10909 -43.70101,-167.56364 -97.74545,-235.57172 -12.54142,6.07677 -24.69495,12.15353 -36.7192,17.71313 3.23233,14.48081 6.46465,29.34949 9.30909,45.12323 10.73132,58.69899 18.61819,131.7495 17.71314,218.76364 36.71919,-13.83434 72.53333,-28.70303 107.44242,-46.02828 z M 224.32323,247.59596 c -2.84444,8.40404 -6.07677,17.19596 -8.79192,26.50505 -17.71313,59.08687 -30.25454,134.46465 -26.50505,227.55556 39.04647,15.38585 84.29899,30.25454 134.98182,41.8909 57.66465,13.05859 126.57778,22.75556 204.8,22.36768 V 310.9495 h -8.40404 c -101.49495,0 -202.47273,-21.46263 -296.08081,-63.35354 z M 550.14141,48.355556 V 289.87475 c 80.03233,-3.23233 168.98586,-20.94546 264.40405,-61.41414 -7.88687,-31.67677 -17.71314,-62.3192 -28.83233,-92.57374 C 716.41212,85.20404 635.34546,54.949495 550.14141,48.355556 Z M 52.622222,432.87273 c 21.850505,13.96363 61.414138,37.23636 115.846468,59.99192 -2.84445,-92.18586 10.21414,-167.04647 27.92727,-226.26263 2.84444,-9.82626 6.07677,-19.13535 9.30909,-27.92727 -20.42828,-9.82627 -37.23636,-19.52324 -49.77778,-27.02223 C 102.4,275.13535 66.973738,351.41818 52.622222,432.87273 Z')

        earth.append("path")
          .attr('d', 'm 845.31717,511.09495 c 1.42222,-104.72727 -9.82626,-192.25859 -25.6,-262.46465 -96.8404,40.98586 -187.60404,58.69899 -269.05858,61.93132 v 255.09495 c 100.07272,-2.97374 199.2404,-21.59192 294.65858,-54.56162 z')

        earth.append("path")
          .attr('d', 'M 845.70505,727.53131 C 882.94142,708.00808 918.75556,685.6404 952.7596,660.0404 969.0505,612.07273 976.93737,562.29495 976.93737,512 c 0,-10.73131 -0.51717,-21.46263 -1.42222,-32.06465 -37.23636,18.10101 -73.95555,33.09899 -110.28687,46.02829 -1.8101,67.49091 -8.27474,134.98181 -19.52323,201.56767 z M 169.50303,516.13737 C 128.12929,499.32929 88.048485,478.90101 49.389899,455.62828 41.890909,516.65455 46.545455,578.45657 62.836364,637.67273 107.05455,667.4101 153.08283,694.04444 201.56768,716.8 182.9495,642.84444 172.73535,576.25859 169.50303,516.13737 Z m 360.2101,283.5394 V 586.47273 h -3.23232 c -114.55354,0 -228.5899,-20.94546 -335.64445,-61.93132 4.13738,60.50909 14.86869,128.51718 35.42627,202.9899 35.81414,15.77374 74.9899,30.25455 117.26868,42.40808 60.50909,17.58384 122.82829,27.41011 186.18182,29.73738 z M 208.93737,742.4 C 162.00404,720.93737 116.88081,696.7596 73.050505,668.83232 108.86465,768.38788 177.26061,852.68687 267.11919,908.02424 244.36364,854.10909 224.8404,798.77172 208.93737,742.4 Z m 320.77576,76.8 c -65.16364,-1.8101 -129.8101,-11.63636 -192.25859,-29.73737 -35.42626,-10.21415 -69.81818,-22.36768 -103.30505,-36.33132 15.77374,53.52728 36.7192,111.19192 63.35354,171.70101 65.68081,34.90909 139.63636,52.62222 214.10909,52.62222 6.07677,0 12.15354,-0.51717 18.10101,-0.51717 z M 213.20404,219.28081 c 15.77374,-40.46869 34.39192,-74.9899 52.62222,-102.91717 -35.42626,21.8505 -67.49091,48.87272 -95.93535,79.12727 11.24848,6.98182 25.6,15.38586 43.31313,23.7899 z m 628.36364,532.94545 c -6.46465,35.42627 -13.96364,71.62829 -23.27273,109.89899 52.10505,-46.02828 93.60808,-102.91717 121.01818,-166.65858 -30.77172,20.81616 -63.35353,39.95151 -97.74545,56.75959 z')

        earth.append("path")
          .attr('d', 'm 550.14141,585.95556 v 213.59191 c 95.41819,0 186.69899,-20.42828 272.80809,-61.02626 13.05858,-74.47272 19.52323,-142.86869 21.46262,-205.70505 -95.0303,32.71111 -194.19798,50.42424 -294.27071,53.1394 z')

        earth.append("path")
          .attr('d', "m 818.81212,762.82828 c -84.81616,37.23637 -175.96768,56.88889 -268.67071,56.88889 v 155.92727 c 87.53132,-6.98181 171.31314,-39.04646 241.5192,-92.18585 10.73131,-41.50303 20.0404,-81.97172 27.15151,-120.63031 z m 15.25657,-543.15959 c 9.30909,-4.13738 18.61818,-8.79192 27.92727,-13.44647 -13.96364,-16.29091 -29.34949,-31.15959 -45.12323,-45.12323 6.07677,17.58384 11.63636,37.23636 17.19596,58.5697 z m -602.24647,8.40404 c 93.60808,42.40808 194.97374,63.35353 297.37374,62.31919 V 47.062626 C 453.30101,43.830303 377.40606,59.60404 309.0101,92.70303 c -25.08283,31.54748 -53.91515,76.67071 -77.18788,135.3697 z")

        earth.selectAll("path")
          .attr('style', "fill:#297aff")

        // 向defs中添加docker图标
        let docker = defs.append('g')
          .attr('id', "docker")
          .attr('transform', 'scale(0.042)');
        docker.append("path")
          .attr('d', "M 1006.7627,438.61333 A 163.24267,163.24267 0 0 0 885.84533,427.648 a 160.85333,160.85333 0 0 0 -65.408,-102.4 L 807.552,315.09333 796.58667,327.46667 a 135.12533,135.12533 0 0 0 -25.6,97.45066 c 1.70666,23.63734 10.15466,46.37867 24.448,65.49334 -11.22134,6.272 -22.99734,11.52 -35.2,15.40266 a 233.38667,233.38667 0 0 1 -72.448,11.69067 H 3.754667 L 2.304,532.82133 a 285.48267,285.48267 0 0 0 24.106667,148.992 l 9.386666,18.51734 1.024,1.70666 c 64.213337,106.19734 192.554667,161.152 315.519997,161.152 238.16534,0 419.328,-113.70666 509.61067,-332.20266 60.33067,3.072 121.94133,-14.29334 151.552,-70.31467 l 7.5093,-14.29333 -14.2506,-7.97867 z m -803.66937,276.352 A 53.546667,53.546667 0 0 1 205.14133,608 53.333333,53.333333 0 0 1 258.048,661.504 54.229333,54.229333 0 0 1 203.09333,714.96533 Z")
          .attr("style", "fill:#039bc5")
        docker.append("path")
          .attr("d", "m 203.09333,633.25867 a 28.16,28.16 0 1 0 28.928,28.24533 28.501333,28.501333 0 0 0 -8.704,-20.13867 27.946667,27.946667 0 0 0 -20.224,-8.10666 z")
          .attr("style", "fill:#38504f")
        docker.append("path")
          .attr("d", "m 54.869333,387.88267 h 97.109337 v 97.152 H 54.912 V 387.84 m 129.49333,0 h 97.10934 v 97.152 h -97.152 V 387.84 m 0,-129.49333 H 281.472 v 97.152 h -97.10933 v -97.10934 m 129.57866,0 h 97.152 v 97.152 h -97.152 v -97.152 m 0,129.49334 h 97.152 v 97.152 h -97.152 V 387.84 m 129.49334,0 h 97.152 v 97.152 h -97.152 V 387.84 m 129.57866,0 h 97.152 v 97.152 h -97.152 V 387.84 M 443.43467,258.34667 h 97.152 v 97.152 h -97.152 v -97.10934 m 0,-129.57866 h 97.152 v 97.152 h -97.152 v -97.152")
          .attr("style", "fill:#2bb558")
      }

      //初始化链接线
      initLink () {
        this.drawLinkLine();
        this.drawLinkText();
      }

      //初始化节点
      initNode () {
        var self = this;
        //节点容器
        this.nodes = this.container.selectAll(".node")
          .data(this.data)
          .enter()
          .append("g")
          .attr("transform", function (d) {
            return "translate(" + d.x + "," + d.y + ")";
          })
          .call(d3.drag()
            // 给每一个节点添加拖拽事件
            .on("drag", function (d) {
              self.onDrag(this, d)
            })
          )
          // 给每一个节点添加点击事件
          .on('click', function () {
            that.dialogVisible = true
          })
        //节点背景默认背景层
        this.nodes.append('circle')
          .attr('r', symbolSize / 1.5 + padding)
          .attr('class', 'node-bg').attr("opacity", "1");

        //节点图标
        this.drawNodeSymbol();
        //节点标题
        this.drawNodeTitle();
        // 节点旁边的小图标
        this.drawNodeCode();
      }

      // 绘制配置完成标识
      drawNodeCode () {
        this.nodeCodes = this.nodes.filter(item => item.isConfig == "true")
          .append('g')
          .attr('class', 'node-code')
          .attr('transform', 'translate(' + -symbolSize / 2 + ',' + symbolSize / 3 + ')')

        this.nodeCodes
          .append('circle')
          .attr('r', () => fontSize * 1)

        this.nodeCodes
          .append('text')
          .attr('dy', fontSize / 1.4)
          // .text(item => item.code);
          .attr("style", "font-size:14px;line-height:14px")
          .text("√");
      }

      //绘制节点图标
      drawNodeSymbol () {
        this.nodes.filter(item => item.type == 'app')
          .append("circle")
          .attr("r", symbolSize / 2)
          .attr("fill", '#fff')
          .attr('class', function (d) {
            return 'health' + d.health;
          })
          .attr('stroke-width', '5px')

        // 在<defs>元素中定义的图形不会直接显示在SVG图像上。要显示它们需要使用<use>元素来引入它们
        // <use>元素通过xlink:href属性来引入<g>元素。注意在ID前面要添加一个#。
        //绘制数据库图标
        this.nodes.filter(item => item.type == 'database')
          .append('use')
          .attr('xlink:href', '#database')
          .attr('x', function () {
            return -this.getBBox().width / 2
          })
          .attr('y', function () {
            return -this.getBBox().height / 2
          })

        //绘制云图标
        this.nodes.filter(item => item.type == 'cloud')
          .append('use')
          .attr('xlink:href', '#cloud')
          .attr('x', function () {
            return -this.getBBox().width / 2
          })
          .attr('y', function () {
            return -this.getBBox().height / 2
          })
        // 绘制地球图标
        this.nodes.filter(item => item.type == 'earth')
          .append('use')
          .attr('xlink:href', '#earth')
          .attr('x', function () {
            return -this.getBBox().width / 2
          })
          .attr('y', function () {
            return -this.getBBox().height / 2
          })
        // 绘制应用图标
        this.nodes.filter(item => item.type == 'myapp')
          .append('use')
          .attr('xlink:href', '#myapp')
          .attr('x', function () {
            return -this.getBBox().width / 2
          })
          .attr('y', function () {
            return -this.getBBox().height / 2
          })
        // 绘制docker图标
        this.nodes.filter(item => item.type == 'docker')
          .append('use')
          .attr('xlink:href', '#docker')
          .attr('x', function () {
            return -this.getBBox().width / 2
          })
          .attr('y', function () {
            return -this.getBBox().height / 2
          })
      }

      //画节点标题
      drawNodeTitle () {
        //节点标题
        this.nodes.append("text")
          .attr('class', 'node-title')
          .text(function (d) {
            return d.name;
          })
          .attr("dy", symbolSize)
        // 处理节点图标中的百分比
        this.nodes.filter(item => item.type == 'app').append("text")
          .text(function (d) {
            return (d.active / d.total) * 100 + "%";
          })
          .attr('dy', fontSize / 2)
          .attr('class', 'node-call')
      }

      // 画节点链接线
      drawLinkLine () {
        let data = this.data;
        if (this.lineGroup) {
          this.lineGroup.selectAll('.link')
            .attr(
              'd', link => genLinkPath(link),
            )
        } else {
          this.lineGroup = this.container.append('g')
          this.lineGroup.selectAll('.link')
            .data(this.edges)
            .enter()
            .append('path')
            .attr('class', 'link')
            .attr(
              'marker-end', (link, i) => 'url(#' + 'marker-' + i + ')'
            ).attr(
              'd', link => genLinkPath(link),
            ).attr(
              'id', (link, i) => 'link-' + i
            )
        }

        // 确认连接线的路径
        function genLinkPath (d) {
          let sx = data[d.source].x;
          let tx = data[d.target].x;
          let sy = data[d.source].y;
          let ty = data[d.target].y;
          return 'M' + sx + ',' + sy +
            ' L' + tx + ',' + ty
        }
      }

      //画节点链接线文字
      drawLinkText () {
        let data = this.data;
        let self = this;
        if (this.lineTextGroup) {
          this.lineTexts
            .attr('transform', getTransform)
        } else {
          this.lineTextGroup = this.container.append('g')

          this.lineTexts = this.lineTextGroup
            .selectAll('.linetext')
            .data(this.edges)
            .enter()
            .append('text')
            .attr('dy', -2)
            .attr('transform', getTransform)
            .on('click', () => { alert() })

          this.lineTexts
            .append('tspan')
            .text((d) => this.data[d.source].upwardText);

          this.lineTexts
            .append('tspan')
            .text((d) => this.data[d.source].underText)
            .attr('dy', '1em')
            .attr('dx', function () {
              return -this.getBBox().width / 2
            })
        }

        function getTransform (link) {
          let s = data[link.source];
          let t = data[link.target];
          let p = self.getCenter(s.x, s.y, t.x, t.y);
          let angle = self.getAngle(s.x, s.y, t.x, t.y);
          if (s.x > t.x && s.y < t.y || s.x < t.x && s.y > t.y) {
            angle = -angle
          }
          return 'translate(' + p[0] + ',' + p[1] + ') rotate(' + angle + ')'
        }
      }

      // 更新视图(图标位置和连接线)
      update () {
        this.drawLinkLine();
        this.drawLinkText();
      }

      //拖拽方法
      onDrag (ele, d) {
        console.log("触发拖拽onDrag")
        d.x = d3.event.x;
        d.y = d3.event.y;
        d3.select(ele)
          .attr('transform', "translate(" + d3.event.x + "," + d3.event.y + ")")
        this.update();
      }

      //缩放方法
      onZoom (ele) {
        this.width = this.svg.attr('width');
        var transform = d3.zoomTransform(ele);
        this.scale = transform.k;
        // this.scale>1则为放大, <1为缩小
        this.container.attr('transform', "translate(" + transform.x + "," + transform.y + ")scale(" + transform.k + ")")
      }

      //主渲染方法
      render () {
        this.scale = 1;
        // 操作svg画布
        this.container = this.svg.append('g')
          .attr('transform', 'scale(' + this.scale + ')')

        // 执行类中定义的方法
        // 1.获取所有节点位置数据
        this.initPosition();
        // 2.初始化图标数据
        this.initDefineSymbol();
        // 3.初始化连接线的信息
        this.initLink();
        // 4.初始化节点
        this.initNode();
        // 5.初始化缩放
        this.initZoom();
      }
    }
3)创建一个topo类
    let t = new Topo('#topo', options);
    t.render();
3.样式部分
<style >
#topo {
  border: 1px solid #ccc;
  user-select: none;
}

#topo text {
  font-size: 10px;
  /*和js里保持一致*/
  fill: #1a2c3f;
  text-anchor: middle;
}

#topo .node-other {
  text-anchor: start;
}

#topo .health1 {
  stroke: #92e1a2;
}

#topo .health2 {
  stroke: orange;
}

#topo .health3 {
  stroke: red;
}

#topo #cloud,
#topo #database {
  fill: #ccc;
}

#topo .link {
  stroke: black;
}

#topo .node-title {
  font-size: 14px;
}

#topo .node-code circle {
  fill: green;
}

#topo .node-code text {
  fill: #fff;
}

#topo .node-bg {
  fill: #fff;
}

#topo .arrow {
  fill: black;
}
</style>
4.拓扑图最终效果

5.总结:
该demo虽然元素比较齐全,但是节点之间的连线点到点直线相连的,若数据量一大节点数量多的话整个topo图的线路会比较杂乱影响观感
3. 完善拓扑图
在调研D3.js过程中,找到了基于D3的类库-dagre-d3;在学习和使用中,随着不断的深入,对于这个类库有了充分的了解,在查看完相关文档之后将其总结一下。
3.1 关于dagre-d3:
Dagre是一个能够在客户端轻松创建流程图的JavaScript类库,而dagre-d3可以理解为是Dagre的前端,它使用D3来进行渲染。
3.2 dagre-d3主要函数:
具体的用法建议直接看d3-dagre源码,这样不会有漏,这里列举下主要函数:
添加节点setNode(v, {label: 'VVV'})
添加边setEdge(v, s)
删除节点removeNode(v)
删除边removeEdge(v,s)
//得到流程图绘制对象
this.graph = new dagreD3.graphlib.Graph().setGraph({
rankdir: this.direction // 控制方向
edgesep: 50, // 连接线水平方向的长度
ranksep: 50 // 连接线竖直方向的长度
}).setDefaultEdgeLabel(function () { return {} })
//绘制节点
this.graph.setNode()
//绘制连接:
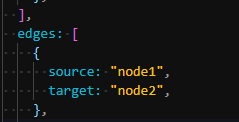
this.graph.setEdge(edges.source, edges.target,{
label: 'text', // 设置连接线上的文字
class: `classname`, // 设置连接线的class名
style: `stroke: ...; fill: none;opacity:1`, // 设置行内样式
arrowheadStyle: `fill: ${color};stroke: ${color};`,
arrowhead: 'vee', // 设置连接线箭头的样式
id: "idname", // 设置连接线的id名
lineInterpolate: "basis" // 节点之间使用曲线连接
})
//删除节点
this.graph.removeNode(v)
//删除边
this.graph.removeEdge(v,s)
demo中的拖拽、缩放功能还是通过D3实现,
3.1 准备工作:
安装dagre-d3:
npm i dagre-d3 --save
3.2 开始绘制
1.html结构
<template>
  <div>
    <button @click="turnDir('LR')">从左至右</button>
    <button @click="turnDir('RL')">从右至左</button>
    <button @click="turnDir('TB')">从上至下</button>
    <button @click="turnDir('BT')">从下至上</button>
    <el-dialog
      center
      title="节点详情"
      :visible.sync="dialogVisible"
      width="50%"
      @closed="subDialogVisible=false"
      @open="subDialogVisible=true"
    >
      <sub-topo v-if="subDialogVisible" />
      <span slot="footer" class="dialog-footer">
        <el-button @click="dialogVisible = false">取 消</el-button>
        <el-button type="primary" @click="dialogVisible = false">确 定</el-button>
      </span>
    </el-dialog>
    <svg width="1800" height="700">
      <g />
    </svg>
  </div>
</template>
2.js部分
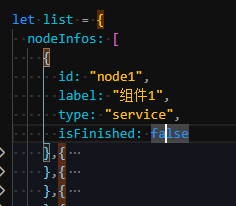
treetopo中模拟的数据结构:
<script>
import list from "../../jsondata/treetopo"
import dagreD3 from "dagre-d3";
import * as d3 from "d3";
import subTopo from "./component/subtopo"
import $ from "jquery"
export default {
components: {
subTopo
},
data () {
return {
dialogVisible: false,
subDialogVisible: false,
direction: "TB"
};
},
methods: {
turnDir (dir) {
this.direction = dir
this.drawTopo()
},
drawTopo () {
//获取D3
var g = new dagreD3.graphlib.Graph().setGraph({
rankdir: this.direction,
edgesep: 50,
ranksep: 50
}).setDefaultEdgeLabel(function () { return {}; });
function drawNode (arr) {
// 添加节点(设置节点的特性)
arr.forEach((item) => {
g.setNode(item.id, { labelType: "html", label: `<i class="${item.type} ${item.isFinished ? "finished" : "unfinished"}"><b>${item.label}</b></i>` });
});
}
drawNode(list.nodeInfos)
// 链接关系(连线的属性)
function drawLine (arr, color, opacity, textobj) {
arr.forEach((item, index) => {
g.setEdge(item.source, item.target, {
label: textobj[index],
lineInterpolate: 'basis',
class: `${item.source}-${item.target}`,
style: `stroke: ${color}; fill: none;opacity:${opacity}`,
arrowheadStyle: `fill: ${color};stroke: ${color};stroke-width:0.1`,
arrowhead: 'vee',
id: "status" + index
});
});
}
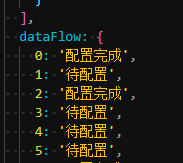
drawLine(list.edges, '#7c7c7c', 1, list.dataFlow);
//绘制图形
var svg = d3.select("svg"),
inner = svg.select("g");
//缩放
var zoom = d3.zoom().on("zoom", function () {
inner.attr("transform", d3.event.transform);
});
svg.call(zoom);
var render = new dagreD3.render();
render(inner, g);
// let code;
//鼠标悬浮事件
inner.selectAll("g.node").on("mouseover", e => {
// 先获取所有的线段,并将这些线段都设置透明度为0.2
$(`g.edgePath`).attr("style", "opacity:0.2")
// 当前的节点名字为e,将所有与e有关的线段添加类名active,进行高亮显示
list.edges.forEach(item => {
$(`.${e}-${item.target}`).addClass("active")
$(`.${item.target}-${e}`).addClass("active2")
$(`.${e}-${item.source}`).addClass("active")
$(`.${item.source}-${e}`).addClass("active")
})
}).on("click ", () => {
this.dialogVisible = true
this.subDialogVisible = true
// d3.event.sourceEvent.stopPropagation();
return false
}).on("mouseout", () => {
drawLine(list.edges, '#7c7c7c', 1, list.dataFlow);
var render = new dagreD3.render();
render(inner, g);
})
var initialScale = 1;
svg.call(
zoom.transform,
d3.zoomIdentity
.translate(
(svg.attr("width") - g.graph().width * initialScale) / 2,
50
)
.scale(initialScale)
);
svg.attr("height", g.graph().height * initialScale + 40);
}
},
mounted () {
this.drawTopo()
}
};
</script>
3.css样式
<style lang="less">
svg {
  font-size: 14px;
  height: 700px;
  width: 1800px;
  border: 1px solid #000;
}

foreignObject {
  width: 50px;
  height: 63px;
  background-color: transparent;
}
.node circle,
.node ellipse,
.node rect {
  fill: transparent;
  stroke-width: 0px;
  stroke: red;
}
.nodes .node rect {
  width: 70px;
  height: 70px;
}
.edgePath path {
  width: 0;
  stroke: #606266;
  fill: #333;
  stroke-width: 1.5px;
}
.database,
.defend,
.service {
  display: inline-block;
  width: 40px;
  height: 40px;
  background-size: contain;
  position: relative;
  overflow: visible;
  background-repeat: no-repeat;
  b {
    position: absolute;
    bottom: -25px;
    left: 50%;
    transform: translateX(-50%);
    font-style: normal;
  }
}
.active,
.active2 {
  stroke-width: 2px;
  opacity: 1 !important;
  path {
    stroke: #f48771 !important;
  }
}
.active2 {
  path {
    stroke: green !important;
  }
}
.database {
  background-image: url("../../assets/database.png");
}
.defend {
  background-image: url("../../assets/defend.png");
}
.service {
  background-image: url("../../assets/service.png");
}
.finished::before {
  content: "√";
  display: inline-block;
  width: 50%;
  height: 50%;
  border-radius: 50%;
  background-color: green;
  position: absolute;
  bottom: 0;
  left: -5px;
  color: #fff;
  text-align: center;
  line-height: 160%;
  font-size: 16px;
}
</style>

总体设计思路:
1.先使用dagre-d3渲染出基础的拓扑图,
2.每一个节点内显示的内容使用i标签代替;并在i标签内插入图标素材,根据不同数据插入不同的图片和标题),