X6 是 AntV 旗下的图编辑引擎,提供了一系列开箱即用的交互组件和简单易用的节点定制能力,方便我们快速搭建流程图、DAG 图、ER 图等图应用.
参考一些网站的写法,然后自己加上了撤销操作。
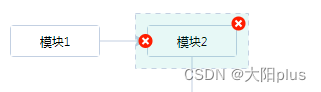
节点和连接线可以进行删除
安装
 npm install @antv/x6 --save
 import { Graph } from '@antv/x6';
代码
<template>
  <div class="wrap">
    <div class="home">
      <div class="menu-bar">
        <!-- 模块列表 -->
        <div class="menu-list">
          <div
            v-for="item in state.moduleList"
            :key="item.id"
            draggable="true"
            @dragend="handleDragEnd($event, item)"
          >
            <plus-outlined />
            <span>{

   { item.name }}</span>
          </div>
          <a-button :disabled="!state.canUndo" @click="onUndo">撤销操作</a-button>
        </div>
        <!-- 画布部分 -->
        <div class="canvas-card">
          <div id="container" @dragover="dragoverDiv"></div>
        </div>
      </div>
    </div>
  </div>
  <page-footer />
</template>

<script setup>
import { onMounted, reactive } from 'vue'
import { DownloadOutlined, PlusOutlined } from '@ant-design/icons-vue'
import { Graph } from '@antv/x6'
import Tools from './js/graphTools.js'

const state = reactive({
  moduleList: [
    {
      id: 1,
      name: '模块1',
      type: 'initial' // 初始模块(用于区分样式)
    },
    {
      id: 2,
      name: '模块2',
      type: 'initial'
    },
    {
      id: 3,
      name: '模块3',
      type: 'logic' // 逻辑模块(用于区分样式)
    },
    {
      id: 4,
      name: '模块4',
      type: 'logic'
    }
  ], // 列表可拖动模块
  graph: null, // 画布实例对象
  curSelectNode: null, // 当前选中的节点
  canUndo: false,
  history: null
})

onMounted(() => {
  initGraph()
})

// 初始化流程图画布
function initGraph() {
  let container = document.getElementById('container')
  state.graph = new Graph({
    container: container, // 画布容器
    width: container.offsetWidth, // 画布宽
    height: container.offsetHeight, // 画布高
    background: false, // 背景(透明)
    snapline: true, // 对齐线
    history: true, // 历史记录
    // 配置连线规则
    connecting: {
      snap: true, // 自动吸附
      allowBlank: false, //是否允许连接到画布空白位置的点
      allowMulti: false, //是否允许在相同的起始节点和终止之间创建多条边
      allowLoop: false, //是否允许创建循环连线,即边的起始节点和终止节点为同一节点
      highlight: true, //拖动边时,是否高亮显示所有可用的节点
      validateEdge({ edge, type, previous }) {
        // 连线时设置折线
        edge.setRouter({
          name: 'er'
        })
        // 设置连线样式
        edge.setAttrs({
          line: {
            stroke: '#275da3',
            strokeWidth: 1
          }
        })
        return true
      }
    },
    panning: {
      enabled: true
    },
    mousewheel: {
      enabled: true // 支持滚动放大缩小
    },
    grid: {
      type: 'mesh',
      size: 5, // 网格大小 10px
      visible: false, // 渲染网格背景
      args: {
        color: '#eeeeee', // 网格线/点颜色
        thickness: 1 // 网格线宽度/网格点大小
      }
    }
  })
  state.history = state.graph.history
  nodeAddEvent()
  state.graph.history.on('change', () => {
    state.canUndo = state.graph.history.canUndo()
  })
}

// 生成节点函数
function addHandleNode(x, y, id, name, type) {
  type === 'initial'
    ? state.graph.addNode(Tools.initInitialNode(x, y, id, name, type))
    : state.graph.addNode(Tools.initLogicNode(x, y, id, name, type))
}
function nodeAddEvent() {
  // 节点绑定点击事件
  state.graph.on('node:click', ({ e, x, y, node, view }) => {
    // 判断是否有选中过节点
    if (state.curSelectNode) {
      // 移除选中状态
      state.curSelectNode.removeTools()
      // 判断两次选中节点是否相同
      if (state.curSelectNode !== node) {
        node.addTools([
          {
            name: 'boundary',
            args: {
              attrs: {
                fill: '#16B8AA',
                stroke: '#c3d0e2',
                strokeWidth: 1,
                fillOpacity: 0.1
              }
            }
          },
          {
            name: 'button-remove',
            args: {
              x: '100%',
              y: 0,
              offset: {
                x: 0,
                y: 0
              }
            }
          }
        ])
        state.curSelectNode = node
      } else {
        state.curSelectNode = null
      }
    } else {
      state.curSelectNode = node
      node.addTools([
        {
          name: 'boundary',
          args: {
            attrs: {
              fill: '#16B8AA',
              stroke: '#c3d0e2',
              strokeWidth: 1,
              fillOpacity: 0.1
            }
          }
        },
        {
          name: 'button-remove',
          args: {
            x: '100%',
            y: 0,
            offset: {
              x: 0,
              y: 0
            }
          }
        }
      ])
    }
  })
  // 连线绑定悬浮事件
  state.graph.on('cell:mouseenter', ({ cell }) => {
    if (cell.shape == 'edge') {
      cell.addTools([
        {
          name: 'button-remove',
          args: {
            x: '100%',
            y: 0,
            offset: {
              x: 0,
              y: 0
            }
          }
        }
      ])
      cell.setAttrs({
        line: {
          stroke: '#c3d0e2'
        }
      })
      cell.zIndex = 99
    }
  })
  state.graph.on('cell:mouseleave', ({ cell }) => {
    if (cell.shape === 'edge') {
      cell.removeTools()
      cell.setAttrs({
        line: {
          stroke: '#c3d0e2'
        }
      })
      cell.zIndex = 1
    }
  })
}
// 拖动后松开鼠标触发事件
function handleDragEnd(e, item) {
  addHandleNode(e.pageX - 240, e.pageY - 40, new Date().getTime(), item.name, item.type)
}
// 拖动节点到画布中鼠标样式变为可拖动状态
function dragoverDiv(ev) {
  ev.preventDefault()
}
function onUndo() {
  state.history.undo()
}
</script>
<style lang="less" scoped>
.wrap {
  margin: 10px;
  height: 100%;
  padding: 20px;
  background: #fff;
  .buttons {
    margin-bottom: 20px;
  }
  .home {
    width: 100%;
    height: 94%;
    display: flex;
    // 模块列表部分
    .menu-bar {
      width: 50%;
      height: 100%;
      margin-right: 20px;
      padding: 20px;
      border: 1px solid #c3d0e2;
      .menu-list {
        display: flex;
        flex-direction: row;
        justify-content: center;
        margin-bottom: 20px;
        > div {
          height: 32px;
          line-height: 32px;
          border: 1px solid #4c84ff;
          color: #4c84ff;
          border-radius: 5px;
          padding: 0 10px;
          margin: 0 20px;
          cursor: pointer;
          box-sizing: border-box;
        }
        span {
          margin-left: 5px;
        }
      }
      // 画布部分
      .canvas-card {
        height: 100%;
        > div {
          width: 100%;
          height: 100%;
        }
      }
    }
  }
}
</style>
<style lang="less">
// 其中节点样式加到没有scoped包裹的style标签中,否则样式不生效
// 初始节点样式
.custom_node_initial {
  width: 100%;
  height: 100%;
  // border: 1px solid #c3d0e2;
  border-radius: 4px;
  display: flex;
  color: #0000;
  flex-direction: column;
  overflow: hidden;
  > div {
    width: 100%;
    height: 100%;
    display: flex;
    align-items: center;
    justify-content: center;
    padding: 5px;
    box-sizing: border-box;
    border: 1px solid #c3d0e2;
    li {
      list-style: none;
      color: #000;
      font-size: 12px;
      overflow: hidden;
      text-overflow: ellipsis;
      white-space: nowrap;
    }
  }
}
// 逻辑节点样式
.custom_node_logic {
  width: 100%;
  height: 100%;
  border: 1px solid #c3d0e2;
  display: flex;
  color: #000;
  flex-direction: column;
  overflow: hidden;
  border-radius: 4px;
  > div {
    width: 100%;
    height: 100%;
    display: flex;
    align-items: center;
    justify-content: center;
    padding: 5px;
    box-sizing: border-box;
    border: 1px solid #c3d0e2;
    border-radius: 5px;
    line-height: 22px;
    li {
      list-style: none;
      color: #000;
      font-size: 12px;
      overflow: hidden;
      text-overflow: ellipsis;
      white-space: nowrap;
    }
  }
}
</style>
graphTools.js
export default {
  /*
  初始化初始节点(开始,结束节点)
  x:x轴坐标
  y:y轴坐标
  id:开始节点id
  name:节点内容,默认为空
  type:节点类型,默认为空
  */
  initInitialNode(x, y, id, name, type) {
    let node = {
      shape: 'html',
      type: type,
      id: id, // String,可选,节点的唯一标识
      x: x, // Number,必选,节点位置的 x 值
      y: y, // Number,必选,节点位置的 y 值
      width: 90, // Number,可选,节点大小的 width 值
      height: 32, // Number,可选,节点大小的 height 值
      html: `
            <div class="custom_node_initial">
              <div>
                <li title=${name}>${name || ''}</li>
              </div>
            </div>
            `,
      attrs: {
        // 这里给生成的节点的body加上透明的边框,一定要给边框宽度加上>0的值,否则节点将不能连线
        body: {
          stroke: 'transparent',
          strokeWidth: 1, // 边框的粗细
          magnet: true // 节点是否可以连线
        }
      }
    }
    return node
  },
  initLogicNode(x, y, id, name, type) {
    let node = {
      shape: 'html',
      type: type, // 动作所属类型
      id: id, // String,可选,节点的唯一标识
      x: x, // Number,必选,节点位置的 x 值
      y: y, // Number,必选,节点位置的 y 值
      width: 90, // Number,可选,节点大小的 width 值
      height: 32, // Number,可选,节点大小的 height 值
      html: `
              <div class="custom_node_logic">
                <div>
                  <li title=${name}>${name || ''}</li>
                </div>
              </div>
            `,
      attrs: {
        body: {
          stroke: 'transparent',
          strokeWidth: 1,
          magnet: true
        }
      }
    }
    return node
  }
}
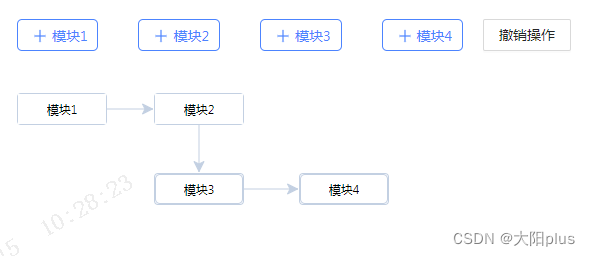
效果
参考网址:https://gitee.com/breencl/x6_learning_demo
X6官网:https://antv-x6.gitee.io/zh/docs/tutorial/getting-started