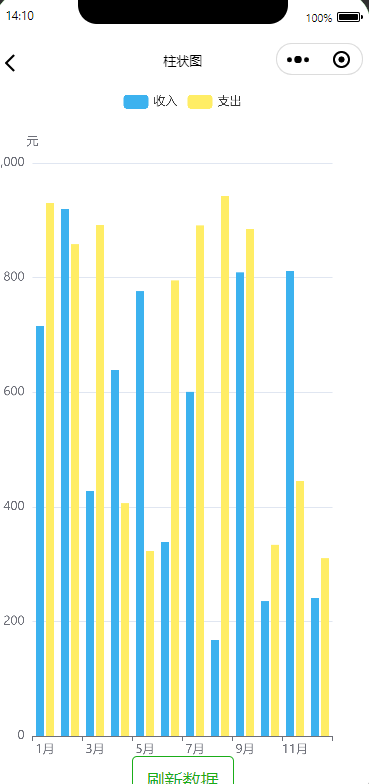
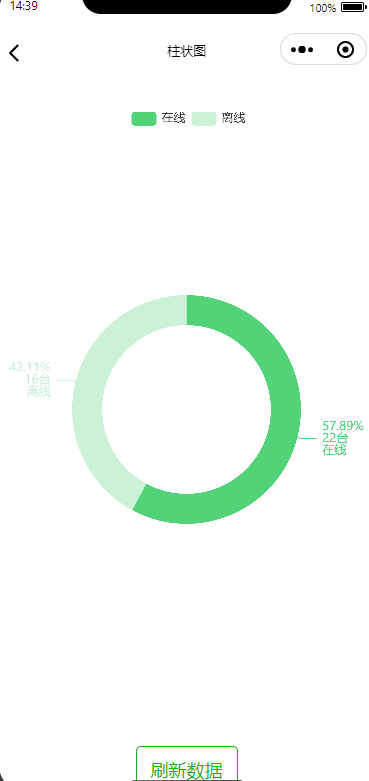
先上图,无图言吊
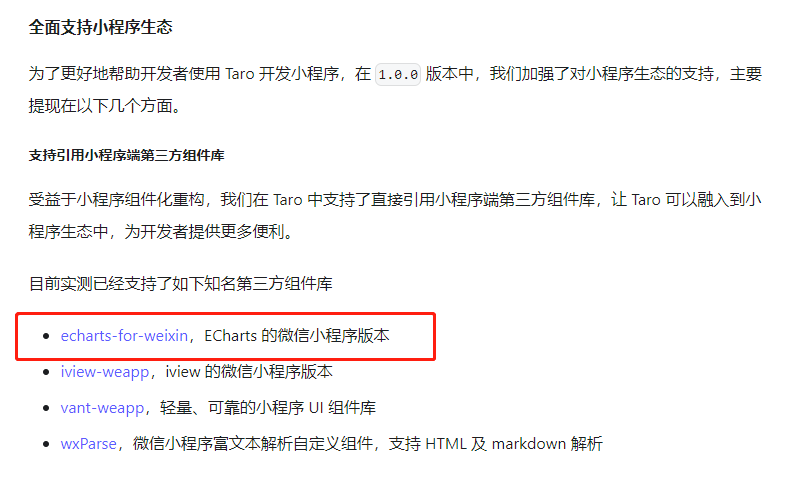
一.taro支持echarts
官方说明:https://taro-docs.jd.com/blog/2018-09-18-taro-1-0-0#支持引用小程序端第三方组件库
二.引入echarts-for-weixin插件
github地址: https://github.com/ecomfe/echarts-for-weixin
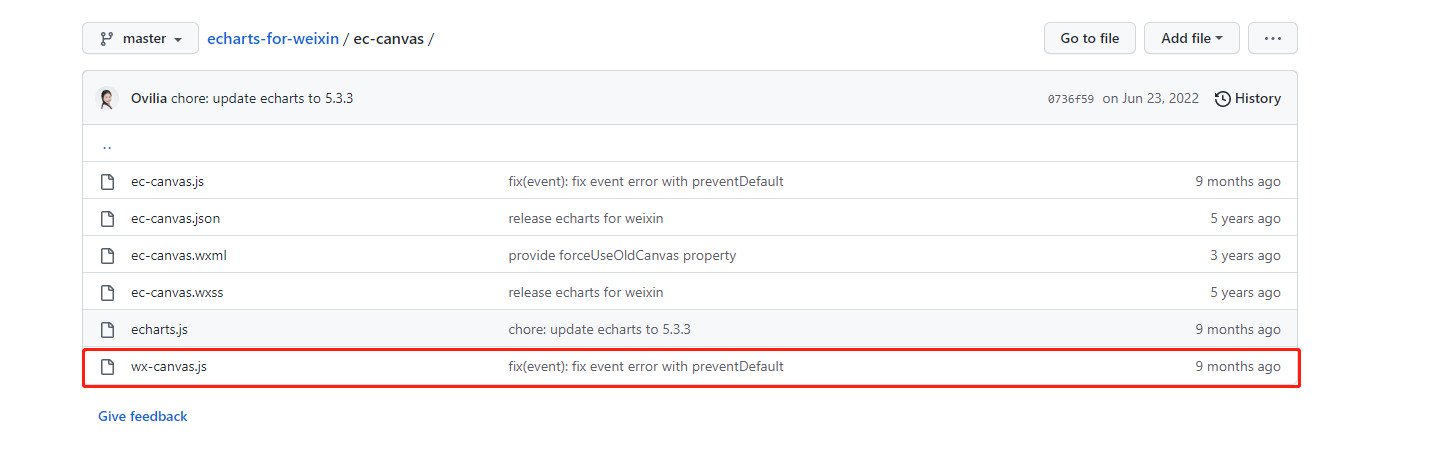
只引入ec-canvas文件夹下的wx-canvas.js
三.自定义 下载echarts
地址: https://echarts.apache.org/zh/builder.html
可自行选择版本,笔者测试了5.3.3和5.4.1都支持
下载后得到echarts.min.js
请根据需要自行选择需要的图表打包下载,我只选了默认的饼图、柱图、线图;
四.封装组件ec-canvas.vue
<template>
  <canvas type="2d" class="ec-canvas" :canvas-id="canvasId" @touchStart="touchStart" @touchMove="touchMove"
    @touchEnd="touchEnd"></canvas>
</template>
引入刚才下载的echarts.min.js和wx-canvas
import Taro from "@tarojs/taro";
import WxCanvas from "./wx-canvas";
import * as echarts from "./echarts-5.4.1.min";
<script lang="js">
//自定义下载的echarts.min.js 文件 要使用需使用js,ts需要声明文件
import Taro from "@tarojs/taro";
import WxCanvas from "./wx-canvas";
import * as echarts from "./echarts-5.4.1.min";
export default {
name: "EcCanvas",
props: {
canvasId: {
type: String,
default: ""
},
ec: {
type: Object,
default: null
}
},
mounted() {
echarts.registerPreprocessor(option => {
if (option && option.series) {
if (option.series.length > 0) {
option.series.forEach(series => {
series.progressive = 0;
});
} else if (typeof option.series === "object") {
option.series.progressive = 0;
}
}
});
if (!this.ec) {
console.warn(
'组件需绑定 ec 变量,例:<ec-canvas id="mychart-dom-bar" ' +
'canvas-id="mychart-bar" ec="{
{ ec }}"></ec-canvas>'
);
return;
}
if (!this.ec.lazyLoad) {
this.init();
}
},
methods: {
init(callback) {
this.initByNewWay(callback);
},
initByNewWay(callback) {
const query = Taro.createSelectorQuery();
query
.select(".ec-canvas")
.fields({
node: true,
size: true
})
.exec(res => {
if (!res || res.length == 0 || res[0] == null || res[0].node == null) {
console.error('未获取到canvas的dom节点,请确认在页面渲染完成后或节点,taro中页面渲染完成的生命周期是useReady');
return
}
const canvasNode = res[0].node;
// this.canvasNode = canvasNode;
const canvasDpr = Taro.getSystemInfoSync().pixelRatio;
const canvasWidth = res[0].width;
const canvasHeight = res[0].height;
const ctx = canvasNode.getContext("2d");
const canvas = new WxCanvas(ctx, this.canvasId, true, canvasNode);
echarts.setCanvasCreator(() => {
return canvas;
});
if (typeof callback === "function") {
this.chart = callback(canvas, canvasWidth, canvasHeight, canvasDpr);
} else if (typeof this.ec.onInit === "function") {
this.chart = this.ec.onInit(
canvas,
canvasWidth,
canvasHeight,
canvasDpr
);
} else {
this.triggerEvent('init', {
canvas: canvas,
width: canvasWidth,
height: canvasHeight,
dpr: canvasDpr
})
}
});
},
canvasToTempFilePath(opt) {
const query = Taro.createSelectorQuery().in(this);
query
.select(".ec-canvas")
.fields({
node: true,
size: true
})
.exec(res => {
const canvasNode = res[0].node;
opt.canvas = canvasNode;
Taro.canvasToTempFilePath(opt);
});
},
touchStart(e) {
if (this.chart && e.touches.length > 0) {
var touch = e.touches[0];
var handler = this.chart.getZr().handler;
handler.dispatch("mousedown", {
zrX: touch.x,
zrY: touch.y
});
handler.dispatch("mousemove", {
zrX: touch.x,
zrY: touch.y
});
handler.processGesture(this.wrapTouch(e), "start");
}
},
touchMove(e) {
if (this.chart && e.touches.length > 0) {
var touch = e.touches[0];
var handler = this.chart.getZr().handler;
handler.dispatch("mousemove", {
zrX: touch.x,
zrY: touch.y
});
handler.processGesture(this.wrapTouch(e), "change");
}
},
touchEnd(e) {
if (this.chart) {
const touch = e.changedTouches ? e.changedTouches[0] : {};
var handler = this.chart.getZr().handler;
handler.dispatch("mouseup", {
zrX: touch.x,
zrY: touch.y
});
handler.dispatch("click", {
zrX: touch.x,
zrY: touch.y
});
handler.processGesture(this.wrapTouch(e), "end");
}
},
wrapTouch(event) {
for (let i = 0; i < event.touches.length; ++i) {
const touch = event.touches[i];
touch.offsetX = touch.x;
touch.offsetY = touch.y;
}
return event;
}
}
};
</script>
<style>
.ec-canvas {
width: 100%;
height: 100%;
}
</style>
五.封装e-chart.vue组件
<script lang=js>
扫描二维码关注公众号,回复: 15509703 查看本文章
使用js避免引入echarts.min.js报错,要求写声明文件.d.ts
不要使用setup语法糖 <script lang=js setup> 会报错
const ecCanvasRef = ref(null); vue3中使用ref获取组件实例 声明与template中ref变量一致
expose vue3向外暴漏子组件方法,同<setup>语法糖里的defineExpose
<template>
    <ec-canvas ref="ecCanvasRef" :canvas-id="canvasId" :ec="ec"></ec-canvas>
</template>

<script lang="js">
/**
 * 自定义下载的echarts.min.js 文件  要使用需使用js,ts需要声明文件
 * 此组件不能使用setup语法糖,会报错的.
 */
import Taro, { useLoad } from "@tarojs/taro";
import * as echarts from './ec-canvas/echarts-5.4.1.min'
import EcCanvas from './ec-canvas/ec-canvas.vue'
import { ref, reactive } from "vue";
export default {
    components: {
        EcCanvas
    },
    props: {
        canvasId: {
            type: String,
            default: ''
        }
    },
    setup(props, { expose }) {
        const ec = reactive({
            lazyLoad: true
        })
        const ecCanvasRef = ref(null);

        const refresh = (options) => {
            if (!ecCanvasRef.value) {
                console.error('ecCanvas未获取到dom');
                return
            }
            ecCanvasRef.value?.init((canvas, width, height, canvasDpr) => {
                const chart = echarts.init(canvas, null, {
                    width: width,
                    height: height,
                    devicePixelRatio: canvasDpr
                })
                canvas.setChart(chart);
                chart.setOption(options);
                return chart;
            })
        }

        expose({
            refresh,
        })
        return {// 返回值会暴露给模板和其他的选项式 API 钩子
            ec, ecCanvasRef
        }
    },
}
</script>
六.使用封装的组件
<template>
    <view class="page">
        <view class="bar-chart">
            <EChart ref="barChat" canvas-id="bar-canvas" />
        </view>
        <button type="primary" :plain="true" @tap="onRefreshData">刷新数据</button>
    </view>
</template>

<script lang="ts" setup>
import Taro, { useReady } from "@tarojs/taro";
import { ref } from "vue";
import { randomArray } from '@/utils/array-util';
const colors = ref(["#3cb2ef", "#ffed65", "#FD665F", "#59d4d4", "#52d378", "#cc33cc", "#336666"]);
useReady(() => {
    initMultiBarChart();
})
const barChat = ref<any>();
const onRefreshData = () => {
    initMultiBarChart();
}
const initMultiBarChart = () => {
    let yData = [
        {
            Name: "收入",
            Value: randomArray(1000, 12)
        },
        {
            Name: "支出",
            Value: randomArray(992, 12)
        },
    ];
    const options = {
        tooltip: {
            trigger: "axis",
            axisPointer: {
                type: "cross",
                crossStyle: {
                    color: "#999",
                },
            },
        },
        grid: {
            y: 80,
            y2: 20,
            borderWidth: 1,
            // top: '90px',//内边距
            // left: '100px',
            // right: '0px',
            // bottom: '0px'
        },
        color: colors.value,
        legend: {
            data: ["收入", "支出"],
            left: "center",
            top: "1%",
        },
        xAxis: [
            {
                type: "category",
                data: ["1月",
                    "2月",
                    "3月",
                    "4月",
                    "5月",
                    "6月",
                    "7月",
                    "8月",
                    "9月",
                    "10月",
                    "11月",
                    "12月",],
                axisPointer: {
                    type: "shadow",
                },
            },
        ],
        yAxis: [
            {
                type: "value",
                name: "元",
                axisLabel: {
                    formatter: "{value}",
                },
            },
        ],
        series: yData.map((item) => {
            return {
                name: item.Name,
                type: "bar",
                barMaxWidth: 30,
                data: item.Value,
            };
        }),
    };
    Taro.nextTick(() => {
        barChat.value.refresh(options)
    })
}
</script>

<style lang="scss">
.bar-chart {
    width: 100%;
    min-height: 500px;
    flex: 1;
}
</style>
七.易错点
ec-canvas中使用Taro.createSelectorQuery()获取不到dom节点
const query = Taro.createSelectorQuery();
      query
        .select(".ec-canvas")
        .fields({
          node: true,
          size: true
        })
        .exec(res=>{

})
Taro.createSelectorQuery()获取节点必须在页面渲染完成后,否则获取到的是null;
在组件和页面里获取略有不同,Taro.createSelectorQuery().in(this)在页面里获取