1.绘制矩形的函数rectangle()
opencv中提供了绘制矩形的函数rectangle()
void cv::rectangle(InputOutputArray img, Point pt1, Point pt2, const Scalar & color, int  thickness = 1,
                   int  lineType = LINE_8, int  shift = 0)

void cv::rectangle(InputOutputArray img, Rect rec, const Scalar & color, int  thickness = 1,
                   int  lineType = LINE_8, int  shift = 0)
参数解释:
pt1:矩形的一个顶点
pt2:矩形中与pt1相对的顶点,即两个点在对角线上。
rec:矩形左上角定点和长宽。
Scalar:颜色bgr
thickness:线宽
lineType: 线型
shift: 坐标点的小数点位数
2.绘制线条的函数line()
该函数利用两点确定一条直线的方式在图像中画出一条直线
void cv::line(InputOutputArray img,Point pt1, Point pt2, const Scalar & color, int thickness = 1, int lineType = LINE_8, int shift = 0)
参数解释:
pt1:直线起始点在图像中的坐标。
pt2:直线终点在图像中的坐标。
color:圆形的颜色,用三通道表示。
3.绘制圆形的函数rectangle()
void cv::circle(InputOutputArray img, Point center, int radius, const Scalar & color, int thickness = 1, int lineType = LINE_8, int shift = 0)
参数解释:
img:需要绘制圆形的图像
center:圆形的圆心位置坐标。
radius:圆形的半径长度,单位为像素。
color:圆形的颜色。
thickness:轮廓的宽度,如果数值为负,则绘制一个实心圆。
lineType:边界的类型,可取值为FILLED ,LINE_4 ,LINE_8 和LINE_AA
shift:中心坐标和半径数值中的小数位数。
4.绘制椭圆的函数ellipse()
void cv::ellipse(InputOutputArray img, Point center, Size axes, double  angle, double  startAngle, double  endAngle,
                 const Scalar & color, int  thickness = 1, int  lineType = LINE_8, int  shift = 0)
参数解释:
center:椭圆的中心坐标。
axes:椭圆主轴大小的一半。
angle:椭圆旋转的角度,单位为度。
startAngle:椭圆弧起始的角度,单位为度。
endAngle:椭圆弧终止的角度,单位为度
在OpenCV 4中还提供了另外一个函数ellipse2Poly()用于输出椭圆的边界的像素坐标,但是不会在图像中绘制椭圆,其函数原型在代码清单3-43中给出。
void cv::ellipse2Poly(Point center, Size axes, int angle, int arcStart, int arcEnd, int delta,
std::vector< Point > & pts)
参数解释:
该函数与绘制椭圆需要输入的参数一致,只是不将椭圆输出到图像中,而是通过vector向量将椭圆边缘的坐标点存储起来,便于后续的再处理
delta:后续折线顶点之间的角度,它定义了近似精度。
pts:椭圆边缘像素坐标向量集合。
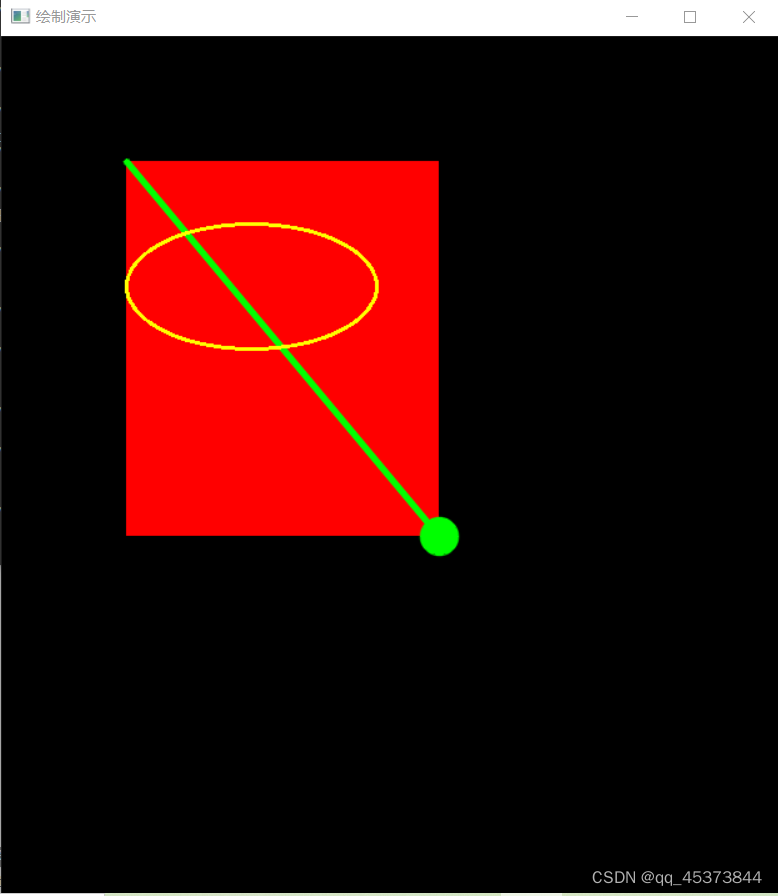
示例代码:
	Rect rect;
	rect.x = 100;
	rect.y = 100;
	rect.width = 250;
	rect.height = 300;

	Mat bg = Mat::zeros(image.size(), image.type());
	rectangle(bg, rect, Scalar(0, 0, 255), -1, 8, 0);
	circle(bg, Point(350,400),15,Scalar(0,255,0),-1,LINE_AA, 0);
	line(bg, Point(100, 100), Point(350, 400), Scalar(0, 255, 0), 4, LINE_AA, 0);

	RotatedRect rrt;
	rrt.center = Point(200,200);
	rrt.size = Size(100,200);
	rrt.angle = 90.0;
	ellipse(bg, rrt, Scalar(0, 255, 255), 2, 8);

	Mat dst;
	addWeighted(image, 0.7, bg, 0.3, 0, dst);
	imshow("绘制演示", bg);
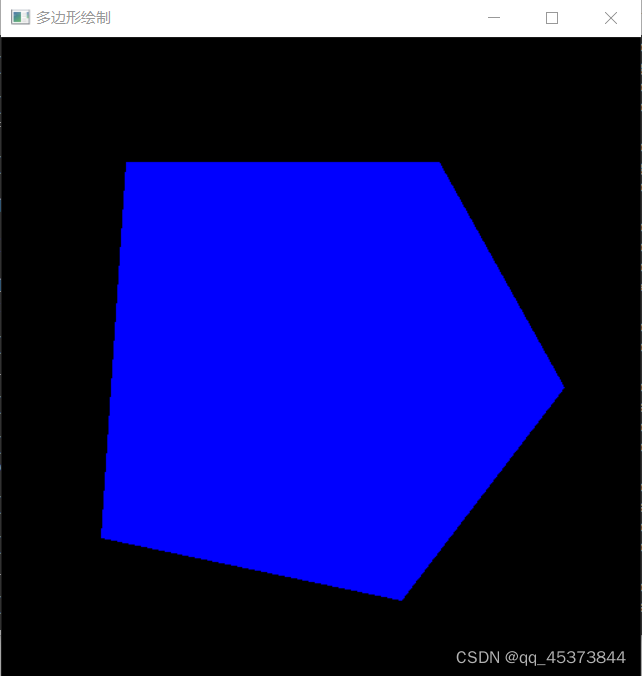
5.绘制多边形的函数
5.1 fillPoly()填充绘制
void cv::fillPoly(
         InputOutputArray  img,
         InputArrayOfArrays       pts,
         const Scalar &        color,
         int   lineType = LINE_8,
         int   shift = 0,
         Point       offset = Point()
参数解释:
img 表示绘制画布,图像
pts 多边形顶点数组,可以存放多个多边形的顶点坐标的数组。
color 表示颜色
lineType 表示线渲染类型
shift 表示相对位移
offset:所有顶点的可选偏移

5.2 polylines()填充绘制
void cv::polylines(
         InputOutputArray  img,
         InputArrayOfArrays       pts,
         bool        isClosed,
         const Scalar &        color,
         int   thickness = 1,
         int   lineType = LINE_8,
         int   shift = 0
)
参数解释:
img 表示绘制画布,图像
pts 表示多边形的点
isClosed 表示是否闭合,默认闭合
color 表示颜色
thickness 表示线宽,必须是正数
lineType 表示线渲染类型
shift 表示相对位移
5.3 drawContours()函数
 1void cv::drawContours (
 2    InputOutputArray  image,
 3    InputArrayOfArrays  contours,
 4    int   contourIdx,
 5    const Scalar &        color,
 6    int   thickness = 1,
 7    int   lineType = LINE_8,
 8    InputArray      hierarchy = noArray(),
 9    int   maxLevel = INT_MAX,
10    Point       offset = Point()
11)
drawContours()可以完成多个多边形的填充与绘制,它本质上把每个多边形的顶点集作为轮廓看待,可以很方便的完成轮廓的绘制与填充,跟点、线、圆、椭圆与矩形的绘制与填充一样,都是通过设置thickness这个参数来实现绘制与填充。只是在输入的时候需要适当改一下。参数controus表示的多个多边形点集合,contourIdx大于零表示绘制指定索引的轮廓,-1表示绘制全部,thickness正数表示绘制,非正数表示填充
示例代码:
	Mat canvas = Mat::zeros(Size(512, 512), CV_8UC3);
	Point p1(100,100);
	Point p2(350, 100);
	Point p3(450, 280);
	Point p4(320, 450);
	Point p5(80, 400);
	std::vector<Point> pts;
	pts.push_back(p1);
	pts.push_back(p2);
	pts.push_back(p3);
	pts.push_back(p4);
	pts.push_back(p5);

	//方法一
	//fillPoly(canvas, pts, Scalar(255, 0, 255), 8, 0);     //多边形填充
	//polylines(canvas, pts, true, Scalar(0,0,255),2,8,0);  //多边形绘制

	// 方法二
	std::vector<std::vector<Point>> contours;  //多边形集合
	contours.push_back(pts);
	drawContours(canvas, contours, -1, Scalar(255,0,0), -1);
	imshow("多边形绘制", canvas);