目录
一、绘制直线
void cv::line   (   InputOutputArray    img,
                    Point   pt1,
                    Point   pt2,
                    const Scalar &      color,
                    int     thickness = 1,
                    int     lineType = LINE_8,
                    int     shift = 0
) -
img: 要绘制线段的图像。
-
pt1: 线段的起点。
-
pt2: 线段的终点。
-
color: 线段的颜色,通过一个Scalar对象定义。
-
thickness: 线条的宽度。
-
lineType: 线段的类型。可以取值8, 4, 和CV_AA, 分别代表8邻接连接线,4邻接连接线和反锯齿连接线。默认值为8邻接。为了获得更好地效果可以选用CV_AA(采用了高斯滤波)。
-
shift: 坐标点小数点位数。
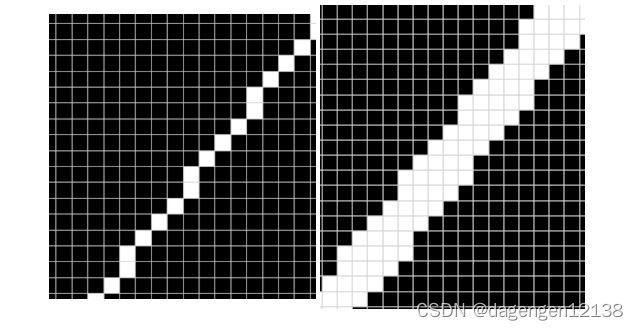
设置线宽分别1和线宽为2的效果图如下:
二、绘制圆形
void cv::circle     (   InputOutputArray    img,
                        Point   center,
                        int     radius,
                        const Scalar &      color,
                        int     thickness = 1,
                        int     lineType = LINE_8,
                        int     shift = 0
                    )

cv.circle( img, center, radius, color[, thickness[, lineType[, shift]]] ) -> img //python-
img 输入和画完形状后输出图像
-
center 圆心坐标
-
radius 圆形的半径
-
color 线条的颜色
-
thickness 如果是正数,表示组成圆的线条的粗细程度。负数如-1,表示圆是否被填充
-
line_type 线条的类型,默认是8。
-
shift 圆心坐标点和半径值的小数点位数
-
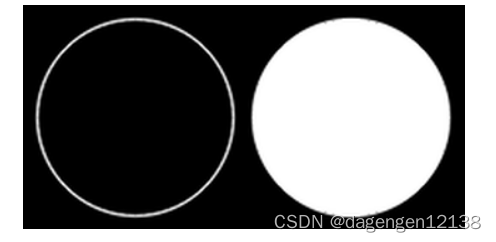
实心圆和空心圆效果如下图:
三、绘制椭圆
第一种重载方式
void cv::ellipse(       InputOutputArray    img,
                        Point               center,
                        Size                axes,
                        double              angle,
                        double              startAngle,
                        double              endAngle,
                        const Scalar &      color,
                        int                 thickness = 1,
                        int                 lineType = LINE_8,
                        int                 shift = 0
                )

Python:
    cv.ellipse( img, center, axes, angle, startAngle, endAngle, color[, thickness[, lineType[, shift]]] ) ->    img
cv.ellipse( img, box, color[, thickness[, lineType]] ) -> img-
Size:椭圆的长轴和短轴,如Size(100,50)代表长轴100短轴50
-
angle:旋转角度
-
startAngle和endAngle分别代表起始和结束角度
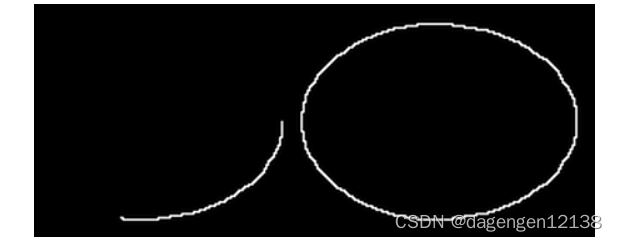
下图是绘制0~100度和绘制完整的椭圆对比
在OpenCV的文档中,为了说明具体的角方向定义、轴方向定义等,还给出了如下的示意图:
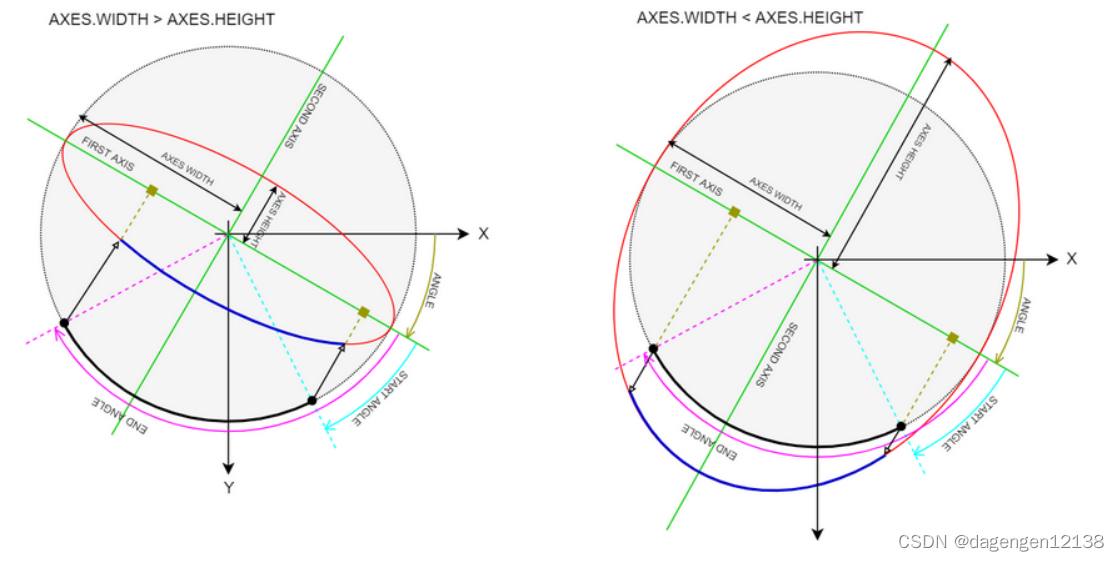
对于第一种情况,椭圆的axes.width > axes.height;、
注意对照示意图,axes.width表示的是椭圆的主轴,即FIRST AXIS,axes.height表示的是椭圆的副轴,即SECOND AXIS,主轴的方向沿图像坐标轴X轴顺时针偏移的方向即为angle;
以主轴axes.width为半径虚拟一个圆,以主轴为基准,顺时针方向偏移start angle角度,得到起始弧段点,由这个点向椭圆主轴做投影,在椭圆弧上的投影点作为椭圆弧段的真正起始点;椭圆弧段的真正结束点也是采取相同的方式获得;
沿顺时针方向,将椭圆弧段的起始点和结束点之间的椭圆弧段绘制出来,即为图中的深蓝色弧,为该模式下绘制出的椭圆弧段;
注意在这种绘制模式下,axes.width和awes.height均表示的是椭圆的半轴长度,这和下一种模式会有区别;
对于第二种情况,即椭圆的axes.width < axes.height时,仍将axes.width所在的轴作为主轴,和第一种情况类似,也仍是以axes.width作为半径虚拟一个圆,各种偏移角、起始角、结束角均与第一种情况类似。第二种重载方式
void cv::ellipse    (   InputOutputArray    img,
                        const RotatedRect &     box,
                        const Scalar &      color,
                        int     thickness = 1,
                        int     lineType = LINE_8
                    )
Python:
    cv.ellipse( img, center, axes, angle, startAngle, endAngle, color[, thickness[, lineType[, shift]]] ) ->    img
    cv.ellipse( img, box, color[, thickness[, lineType]]    ) ->    img
这种方式将椭圆的形状参数全部归并到一个RotatedRect对象即box中。 RotatedRect共有三个属性:分别是angle center size 这个数据结构的理解很容易:center表示矩形的中心点;angle表示矩形顺时针偏转的角度;size中分别表示矩形的width和height。注意RotatedRect中,size.width也是作为主轴存在的。如:
RotateREct(Point2f(100.0,200.0),size(100,50),Scalar(255,255,255))四、绘制方形
//方法一
void cv::rectangle  (   InputOutputArray    img,
                        Point   pt1,
                        Point   pt2,
                        const Scalar &      color,
                        int     thickness = 1,
                        int     lineType = LINE_8,
                        int     shift = 0
                    )
Python:
    cv.rectangle(   img, pt1, pt2, color[, thickness[, lineType[, shift]]]  ) ->    img
    cv.rectangle(   img, rec, color[, thickness[, lineType[, shift]]]   ) ->    img

//方法二
void cv::rectangle  (   InputOutputArray    img,
                        Rect    rec,
                        const Scalar &      color,
                        int     thickness = 1,
                        int     lineType = LINE_8,
                        int     shift = 0
                    )
Python:
    cv.rectangle(   img, pt1, pt2, color[, thickness[, lineType[, shift]]]  ) ->    img
cv.rectangle( img, rec, color[, thickness[, lineType[, shift]]] ) -> img-
pt1 矩形的顶点。
-
pt2 与 pt1 相对的矩形的顶点。意思是pt1和pt2是对角顶点
-
rec是两个顶点的集合,如:Rect(100, 100, 150, 200)
-
五、绘制多边形
void cv::fillPoly   (   InputOutputArray    img,
                    const Point **      pts,
                    const int *     npts,
                    int     ncontours,
                    const Scalar &      color,
                    int     lineType = LINE_8,
                    int     shift = 0,
                    Point   offset = Point()
                )
Python:
cv.fillPoly( img, pts, color[, lineType[, shift[, offset]]] ) -> img-
pts:多边形顶点数组,可以存放多个多边形顶点坐标的数组,注意其数据类型是const Point **,数组内存放的是数组的地址
-
npts:每个多边形顶点的个数
-
ncontours:绘制多边形的个数,以上三个参数要求是一一对应的
-
offset:所有顶点的偏移
绘制结果图如下:
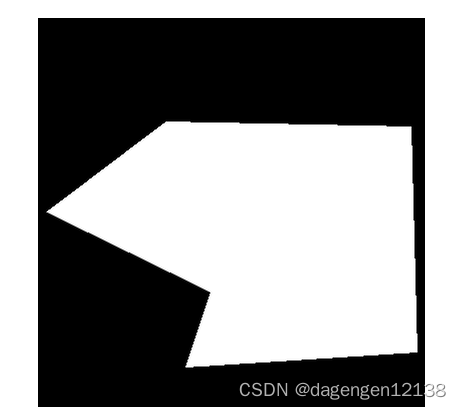
Point root_points[1][6];
    root_points[0][0] = Point(215, 220);
    root_points[0][1] = Point(460, 225);
    root_points[0][2] = Point(466, 450);
    root_points[0][3] = Point(235, 465);
    root_points[0][4] = Point(260, 390);
    root_points[0][5] = Point(96, 310);
    const Point* pp[] = { root_points[0]};
    int nps[] = { 6 };
    fillPoly(img, pp, nps,1, Scalar(255, 255, 255), 8);
六、文字生成
void cv::putText    (   InputOutputArray    img,
                        const String &      text,
                        Point   org,
                        int     fontFace,
                        double      fontScale,
                        Scalar      color,
                        int     thickness = 1,
                        int     lineType = LINE_8,
                        bool    bottomLeftOrigin = false
                    )
Python:
cv.putText( img, text, org, fontFace, fontScale, color[, thickness[, lineType[, bottomLeftOrigin]]] ) -> img-
Point org: 第一个字符左下角坐标
-
int fontFace:字体类型,FONT_HERSHEY_SIMPLEX ,FONT_HERSHEY_PLAIN ,FONT_HERSHEY_DUPLEX 等等等。
-
double fontScale,字体大小
-
Scalar color,字体颜色,颜色用Scalar()表示。
-
lineType,线型,我们使用默认值8.
-
bottomLeftOrigin:图像数据原点的位置,默认为左上角,参数改为true,则原点为左下角
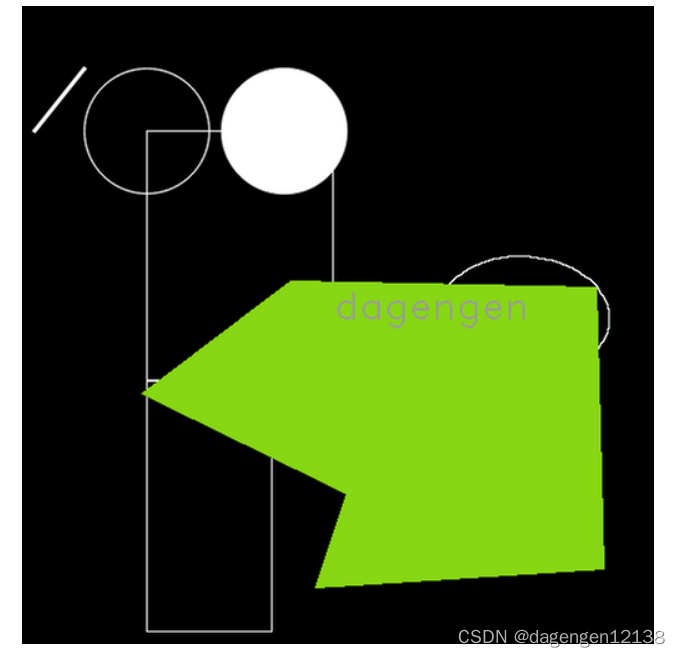
七、实操
#include<opencv2/opencv.hpp>
#include<iostream>
#include<vector>
using namespace std;
using namespace cv;
int main()
{
Mat img = Mat::zeros(512, 512, CV_8UC3);
Point p1(10, 100);
Point p2(50,50);
//绘制直线
line(img, p1, p2, Scalar(255, 255, 255), 2, LINE_AA,0);
circle(img, Point(100, 100), 50, Scalar(255, 255, 255), 1, LINE_AA, 0);
//绘制实心圆
circle(img, Point(210, 100), 50, Scalar(255, 255, 255), -1, LINE_AA, 0);
//绘制椭圆
ellipse(img, Point(250, 250), Size(70, 50), 0, 0, 100, Scalar(255, 255, 255), 1, LINE_4, 0);
ellipse(img, Point(400, 250), Size(70, 50), 0, 0, 360, Scalar(255, 255, 255), 1, LINE_4, 0);
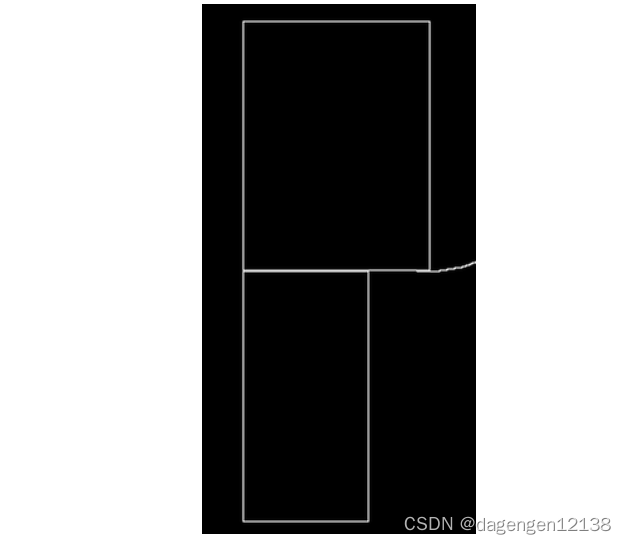
//绘制方形
rectangle(img, Point(100, 300), Point(200, 500), Scalar(255, 255, 255));
rectangle(img, Rect(100, 100, 150, 200), Scalar(255, 255, 255));
//绘制多边形
Point root_points[1][6];
root_points[0][0] = Point(215, 220);
root_points[0][1] = Point(460, 225);
root_points[0][2] = Point(466, 450);
root_points[0][3] = Point(235, 465);
root_points[0][4] = Point(260, 390);
root_points[0][5] = Point(96, 310);
const Point* pp[] = { root_points[0]};
int nps[] = { 6 };
fillPoly(img, pp, nps,1, Scalar(20, 215, 135), 8);
//生成文字
putText(img, "dagengen", Point(250, 250), 2, 1, Scalar(155, 155, 155));
waitKey(1);
return 0;
}生成结果图如下: