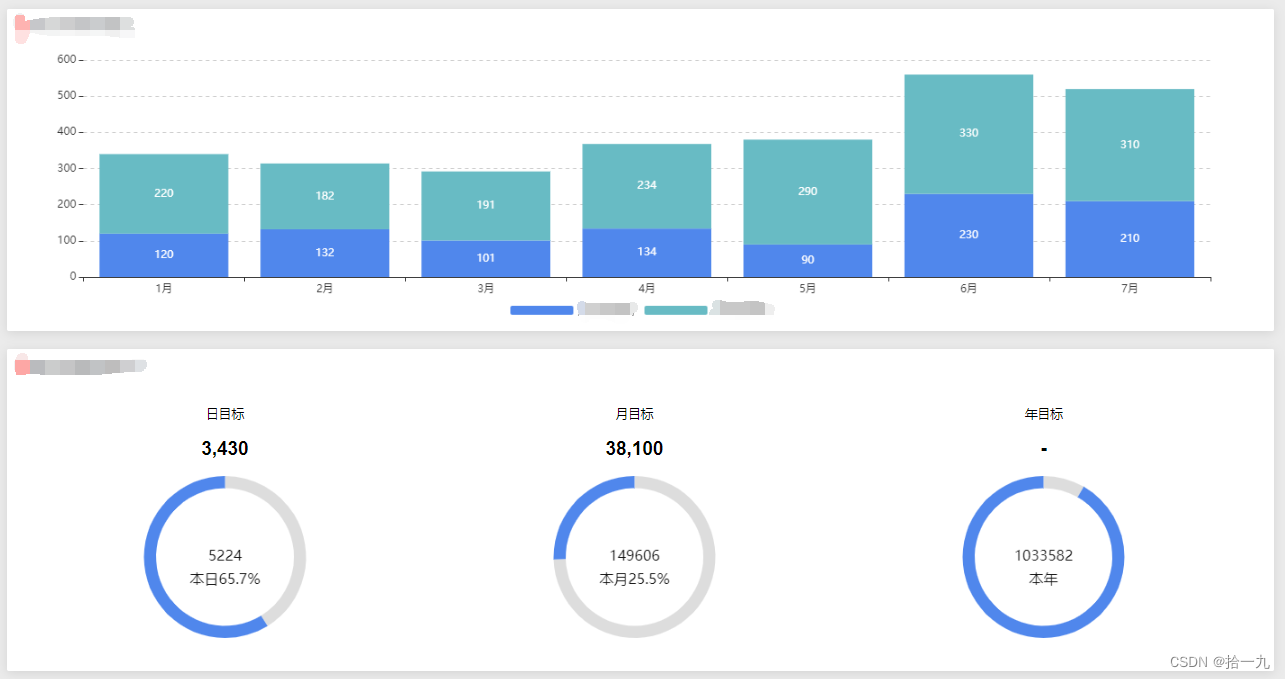
效果图
1、在项目中引入echarts依赖
npm install echarts --save
–save自动把模块和版本号添加到模块配置文件package.json中的依赖dependencies部分
2、在制作图表的页面引入echarts
`import echarts from ‘echarts’
3、编写代码
<template>
  <div>
    <!-- 柱状图 -->
    <div class="container">
        <div id="echartTop"></div>
    </div>
    <div class="" style="width: 100%;">
      <!-- 环形图 -->
      <div class="container">
        <div v-for="(item, index) in rateList" :key="index" class="item">
          <h4>{

   {item.title || '-'}}</h4>
          <h2 style="font-weight: 700;">{

   {item.value || '-'}}</h2>
          <div :id="`echartBottom${index+1}`"></div>
        </div>
      </div>
    </div>
  </div>
</template>

<script>
import echarts from 'echarts'

export default {
  name: "index",
  data() {
    return {
      topChartsData: {
        xAxisData: ['1月', '2月', '3月', '4月', '5月', '6月', '7月'],
        arr1: [120, 132, 101, 134, 90, 230, 210],
        arr2: [220, 182, 191, 234, 290, 330, 310]
      },
      rateList: [
        {
          title: '日目标',
          total: '5224',
          value: '3430',
          data:[
            { value: 735, name: '1' },
            { value: 1048, name: '2' }
          ]
        },
        {
          title: '月目标',
          total: '149606',
          value: '38100',
          data:[
            { value: 111506, name: '1' },
            { value: 38100, name: '2' }
          ]
        },
        {
          title: '年目标',
          total: '1033582',
          value: '-',
          data:[
            { value: 93022.38, name: '1' },
            { value: 1033582, name: '2' }
          ]
        },
      ],
      myChartTop: null,
      myChartBottom1: null,
      myChartBottom2: null,
      myChartBottom3: null,
    }
  },
  mounted() {
    this.initCharts()
    window.addEventListener('resize', (e) => {
      // 监听屏幕大小变化,让图表大小自适应
      this.myChartTop && this.myChartTop.resize()
      this.myChartBottom1 && this.myChartBottom1.resize()
      this.myChartBottom2 && this.myChartBottom2.resize()
      this.myChartBottom3 && this.myChartBottom3.resize()
    })
  },
  methods: {
    /** 初始化图表 */
    initCharts() {
      this.getLoadEchartsTop();
      this.rateList.forEach((v,i) => {
        this.getLoadEchartsBottom(i, `echartBottom${i+1}`, v);
      })
    },
    /** 柱状图 */
    getLoadEchartsTop() {
      this.myChartTop = echarts.init(
        document.getElementById('echartTop')
      );
      let optionTop = {
        tooltip: {
          trigger: 'axis',
          axisPointer: {
            type: 'shadow'
          }
        },
        legend: {
          textStyle: {
            //图例字体大小
            fontSize: 16,
            color: '#101010'
          },
          // 图例宽高
          itemWidth: 70,
          itemHeight: 10,
          // 图例位置
          bottom: 0
        },
        grid: {
          top: '3%',
          left: '3%',
          right: '4%',
          bottom: '10%',
          containLabel: true
        },
        color: ['#5087EC', '#68BBC4'], // 颜色
        xAxis: {
          type: 'category',
          data: this.topChartsData.xAxisData
        },
        yAxis: {
          type: 'value',
          axisLine: {
            show: false, //隐藏y轴
          },
          splitLine: {
            show: true,
            lineStyle: {
              type: 'dashed',
            },
          },
        },
        series: [
          {
            name: 'A',
            type: 'bar',
            stack: 'Ad',
            label: {
              show: true
            },
            emphasis: {
              focus: 'series'
            },
            data: this.topChartsData.arr1
          },
          {
            name: 'B',
            type: 'bar',
            stack: 'Ad',
            label: {
              show: true
            },
            emphasis: {
              focus: 'series'
            },
            data: this.topChartsData.arr2
          }
        ]
      };
      this.myChartTop.setOption(optionTop);
    },
    /** 环形图 */
    getLoadEchartsBottom(i, id, v) {
      const rate = ((Number(v.value)/Number(v.total))*100).toFixed(1)
      const subtext = i==0 ? `本日${rate}%`: i==1 ? `本月${rate}%` : `本年`
      let myChart = i==0? this.myChartBottom1 : i==1 ? this.myChartBottom2 : this.myChartBottom3
      myChart = echarts.init(
        document.getElementById(id)
      );
      let option = {
        tooltip: {
          trigger: 'item'
        },
        legend: {
          show: false // 是否显示图例
        },
        title: {
          text: v.total, //主标题
          subtext, // 副标题
          left: 'center',
          top: 'center',
          itemGap: 10, // 主副标题相隔间距
          textStyle: { // 主标题样式
            fontSize: 16,
            fontWeight: 400,
            color: '#101010'
          },
          subtextStyle: { // 主标题样式
            fontSize: 16,
            fontWeight: 400,
            color: '#101010'
          }
        },
        series: [
          {
            name: v.title,
            type: 'pie',
            radius: ['100%', '85%'], // 环比 圈的大小
            center: ['50%', '50%'], // 图形在整个canvas中的位置 左 上
            color: ['#ddd', '#5087EC'], // item的取色盘
            label: {
              show: false // 是否显示item标题
            },
            hoverAnimation: false, // 关闭鼠标移入时的动画效果
            labelLine: { show: false },
            data: v.data
          }
        ]
      }
      myChart.setOption(option);
    }
  }
}
</script>

<style lang="scss" scoped>
  .container{
    width: 100%;
    height: 300px;
    display: flex;
    #echartTop{
      width: 100%;
      height: 100%;
    }
    .item {
      width: 33%;
      text-align: center;
      #echartBottom1, #echartBottom2, #echartBottom3{
        width: 100%;
        height: 60%;
      }
    }
  }
</style>