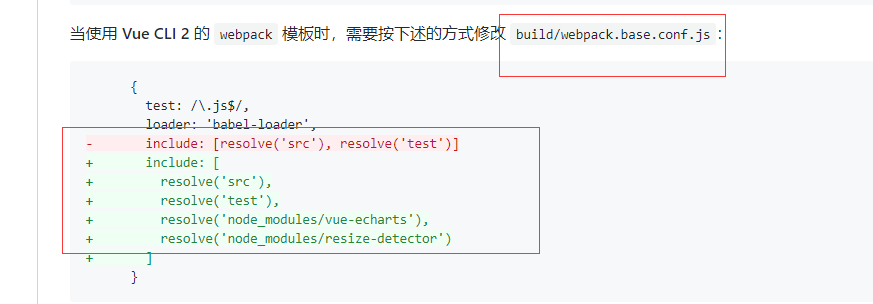
按照这里的操作
https://github.com/ecomfe/vue-echarts/blob/master/README.zh_CN.md
安装 echarts
修改

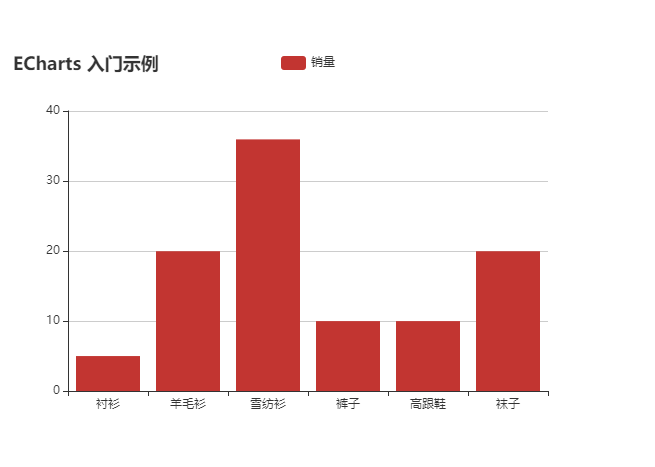
结合 这里的例子,它是用js链接
https://echarts.apache.org/zh/tutorial.html#5%20%E5%88%86%E9%92%9F%E4%B8%8A%E6%89%8B%20ECharts
代码有点不一样
页面代码
<template>
   <div>
       <v-chart :options="options" style="width: 600px;height:400px;"></v-chart>

   </div>
</template>
<script>
export default {
  data () {
    return {
      options: {
          title: {
                text: 'ECharts 入门示例'
            },
            tooltip: {},
            legend: {
                data:['销量']
            },
            xAxis: {
                data: ["衬衫","羊毛衫","雪纺衫","裤子","高跟鞋","袜子"]
            },
            yAxis: {},
            series: [{
                name: '销量',
                type: 'bar',
                data: [5, 20, 36, 10, 10, 20]
            }]
      }
    }
  }
}
</script>

<style>

</style>
效果
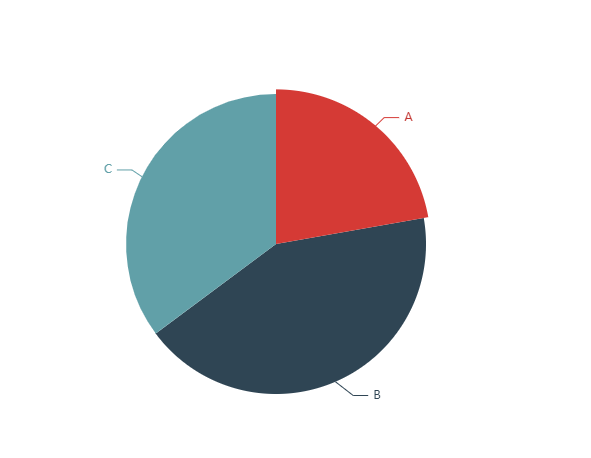
例子2
<template>
   <div>
       <v-chart :options="options" style="width: 600px;height:400px;"></v-chart>

   </div>
</template>
<script>
export default {
  data () {
    return {
      options: {
         series: {
                type: 'pie',
                data: [
                    {name: 'A', value: 1212},
                    {name: 'B', value: 2323},
                    {name: 'C', value: 1919}
                ]
            }
      }
    }
  }
}
</script>

<style>

</style>
效果图