在 3.1.1 版本之前 ECharts 在 npm 上的 package 是非官方维护的,从 3.1.1 开始由官方 EFE 维护 npm 上 ECharts 和 zrender 的 package。
你可以使用如下命令通过 npm 安装 ECharts
npm install echarts --save
全局引入和按需引入
main.js
// 引入echarts
import echarts from 'echarts'
Vue.prototype.$echarts = echarts
<template>
  <div>
    <div
     id='barchart'
     :style="{width:'600px',height:'300px'}">
    </div>
  </div>
</template>

<script>
export default {
  name: 'Bar',
  mounted () {
    this.drawBar()
  },
  methods: {
    drawBar () {
      let myCharts = this.$echarts.init(document.getElementById('barchart'))
      myCharts.setOption({
        backgroundColor: '#21202D',
        title: {
          text: '过去七日交易额',
          x: 'center',
          textStyle: {
            color: '#fff'
          }
        },
        tooltip: {
          trigger: 'axis'
        },
        legend: {
          data: ['交易额', '交易量'],
          left: 'center',
          bottom: '0',
          textStyle: {
            color: '#fff'
          }
        },
        xAxis: [
          {
            type: 'category',
            position: 'bottom',
            data: [
              '星期一', '星期二', '星期三', '星期四', '星期五', '星期六', '星期日'
            ],
            axisTick: {
              lineStyle: {
                color: '#fff'
              }
            },
            axisLabel: {
              textStyle: {
                color: '#fff'
              },
              rotate: 30
            }
          }
        ],
        yAxis: [
          {
            type: 'value',
            axisLine: {
              lineStyle: {
                color: '#fff'
              }
            }
          }
        ],
        series: [
          {
            name: '交易额',
            type: 'bar',
            data: [2000, 2300, 2400, 2500, 3100, 2100, 2800]
          },
          {
            name: '交易量',
            type: 'line',
            symbol: 'rect',
            symbolSize: 10,
            lineStyle: {
              normal: {
                width: 4
              }
            },
            data: [2023, 3044, 2044, 2250, 1450, 3440, 2270]
          }
        ]
      })
    }
  }
}
</script>
还有直接在页面中引用,不是所有页面都引入,官网:
let echarts = require('echarts')
export default {
  name: 'Bar',
  mounted () {
    this.drawBar()
  },
  methods: {
    drawBar () {
      let myCharts = echarts.init(document.getElementById('barchart'))
按需引入:
默认使用 require('echarts') 得到的是已经加载了所有图表和组件的 ECharts 包,因此体积会比较大,如果在项目中对体积要求比较苛刻,也可以只按需引入需要的模块。
// 引入基本模板
let echarts = require('echarts/lib/echarts')
// 引入柱状图组件
require('echarts/lib/chart/bar')
// 引入折线图组件
require('echarts/lib/chart/line')
// 引入提示框和title组件
require('echarts/lib/component/tooltip')
require('echarts/lib/component/title')
按需引入app.js从3MB到2.1MB
关于vue封装echarts组件
我们封装一个echarts的图表,注意不要使用document.getElementByid来操作DOM元素,否则多次引用会无效,使用ref来操作DOM元素
<template>
  <div>
    <div
     ref='barchart'
     :style="{width:'600px',height:'300px'}">
    </div>
  </div>
</template>
<script>
// 引入基本模板
let echarts = require('echarts/lib/echarts')
// 引入柱状图组件
require('echarts/lib/chart/bar')
// 引入折线图组件
require('echarts/lib/chart/line')
// 引入提示框和title组件
require('echarts/lib/component/tooltip')
require('echarts/lib/component/title')
export default {
  name: 'Bar',
  props: {
    texttitle: String,
    textlink: String,
    legenddata: Array,
    axisdata: Array,
    seriesdata: Array
  },
  data () {
    return {
      title: this.texttitle,
      link: this.textlink,
      legend_data: this.legenddata,
      axis_data: this.axisdata,
      series_data: this.seriesdata
    }
  },
  mounted () {
    this.drawBar()
  },
  methods: {
    drawBar () {
      let myCharts = echarts.init(this.$refs.barchart)
      myCharts.setOption({
        backgroundColor: '#21202D',
        title: {
          text: this.title,
          x: 'center',
          link: this.link,
          textStyle: {
            color: '#fff'
          }
        },
        tooltip: {
          trigger: 'axis'
        },
        legend: {
          data: this.legend_data,
          left: 'center',
          bottom: '0',
          textStyle: {
            color: '#fff'
          }
        },
        xAxis: [
          {
            type: 'category',
            position: 'bottom',
            data: this.axis_data,
            axisTick: {
              lineStyle: {
                color: '#fff'
              }
            },
            axisLabel: {
              textStyle: {
                color: '#fff'
              },
              rotate: 30
            }
          }
        ],
        yAxis: [
          {
            type: 'value',
            axisLine: {
              lineStyle: {
                color: '#fff'
              }
            }
          }
        ],
        series: this.series_data
      })
    }
  }
}
</script>

<style lang='less' scoped>
</style>
封装的图表组件是根据外部传的值来生成相应的图表,所以需要接收外部传来的参数,注意我们最好不要直接使用传进来的值,为了避免单项数据流的问题,我们在子组件中接收重新定义一下,注意命名不要和props接收的命名相同
封装好了我们就可以在父组件中使用了,引入注册标签使用,然后将需要生成图表的值传到该组件中。
<template>
  <div>
      <bar
       :texttitle='texttitle'
       :textlink='textlink'
       :legenddata='legenddata'
       :axisdata='axisdata'
       :seriesdata='seriesdata'
      ></bar>
      <bar
       :texttitle='texttitle'
       :textlink='textlink'
       :legenddata='legenddata'
       :axisdata='axisdata'
       :seriesdata='seriesdata'
      ></bar>
  </div>
</template>
  data () {
    return {
      texttitle: '过去七日交易额',
      textlink: 'https://www.baidu.com',
      legenddata: ['交易额', '交易量'],
      axisdata: [
        '星期一', '星期二', '星期三', '星期四', '星期五', '星期六', '星期日'
      ],
      seriesdata: [
        {
          name: '交易额',
          type: 'bar',
          data: [2000, 2300, 2400, 2500, 3100, 2100, 2800]
        },
        {
          name: '交易量',
          type: 'line',
          symbol: 'rect',
          symbolSize: 10,
          lineStyle: {
            normal: {
              width: 4
            }
          },
          data: [2023, 3044, 2044, 2250, 1450, 3440, 2270]
        }
      ]
    }
  }
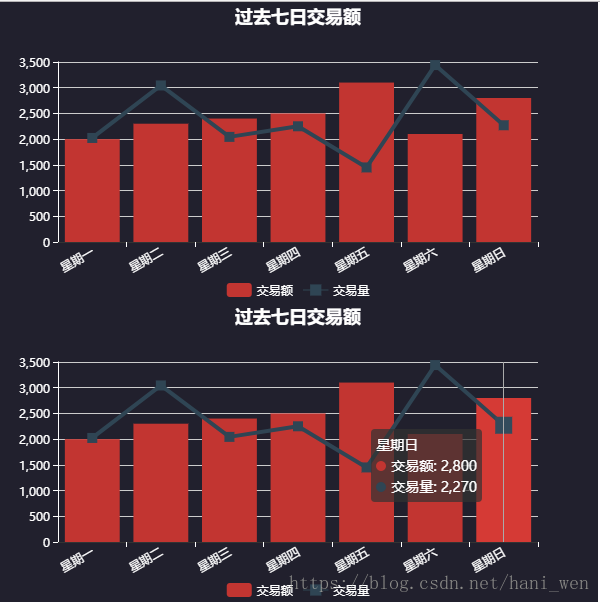
效果:
如果使用传统的getElementById 来获取DOmain元素操作元素,就不会出现两个了,只能生成一个。