很多时候我们只管使用数据,而不知道数据之间的差异在那里,所以我们可以选择相同的点然后加载不同的数据集,然后查看某个点的时序影像来实现影像差异对比。
Landsat 8是由美国地质调查局(USGS)运行的陆地观测卫星,于2013年发射。它具有高分辨率的传感器(OLI和TIRS),可捕捉可见光、红外线和热红外线波段的数据,为地球科学家、资源管理人员和环境监测人员提供了有价值的信息。 Landsat 8影像可以用于许多应用,如土地利用/土地覆盖分类、森林管理、水资源管理、城市规划、矿产资源勘探等等。另外,Landsat 8数据也被广泛应用于自然灾害监测和应急响应。
Sentinel-2是欧洲空间局(ESA)推出的地球观测卫星,主要用于环境监测、地表覆盖变化检测、农业、森林和城市规划等领域。Sentinel-2具有高分辨率、广泛的覆盖范围、高频率的重访时间和多光谱能力,能够获取多种光谱波段的高分辨率影像数据,包括可见光、近红外和短波红外等。这些影像数据对于区分地表覆盖类型(如植被、水体、土地利用等)和监测环境变化非常有用。Sentinel-2影像数据可以通过ESA的数据门户或地球观测数据共享平台(GEE)等渠道获取。
MODIS是美国国家航空航天局(NASA)和美国地球观测系统(EOS)的一部分,是一种遥感技术,旨在捕捉地球表面和大气层的图像。MODIS影像可以用于监测和分析地表覆盖、气候变化、环境污染、自然灾害等多个领域的数据,因此在环境科学、气象学、农业、林业、水资源管理、城市规划等领域得到了广泛应用。MODIS影像的分辨率从250m至1km不等,可以提供全球99%覆盖率和每日多次观察,满足了许多科学家、政策制定者和其他研究人员对数据的需求。
函数:
ui.Chart.image.seriesByRegion(imageCollection, regions, reducer, band, scale, xProperty, seriesProperty)
Generates a Chart from an image collection. Extracts and plots the value of the specified band in each region for each image in the collection. Usually a time series.
-
X-axis = Image labeled by xProperty (default: 'system:time_start').
-
Y-axis = Reducer output.
-
Series = Region labeled by seriesProperty (default: 'system:index').
Returns a chart.
Arguments:
imageCollection (ImageCollection):
An ImageCollection with data to be included in the chart.
regions (Feature|FeatureCollection|Geometry|List<Feature>|List<Geometry>):
The regions to reduce.
reducer (Reducer):
Reducer that generates the value for the y-axis. Must return a single value.
band (Number|String, optional):
The band name to reduce using the reducer. Defaults to the first band.
scale (Number, optional):
Scale to use with the reducer in meters.
xProperty (String, optional):
Property to be used as the label for each image on the x-axis. Defaults to 'system:time_start'.
seriesProperty (String, optional):
Property of features in opt_regions to be used for series labels. Defaults to 'system:index'.
Returns: ui.Chart
代码:
var AOI =
/* color: #d63000 */
/* displayProperties: [
{
"type": "rectangle"
}
] */
ee.Geometry.Polygon(
[[[-103.60307723271508, 44.88240786607988],
[-103.60307723271508, 44.88233802278273],
[-103.60242947923798, 44.88233802278273],
[-103.60242947923798, 44.88240786607988]]], null, false),
Point_1 = /* color: #98ff00 */ee.Geometry.Point([-103.60279560076852, 44.88238125911955]);
var AOI = AOI, Point_1 = Point_1;
//Sentinel 2 Image ------------------------------------------------------------
var startDateS2 = ee.Date.fromYMD(2016,1,1);
var endDateS2 = ee.Date.fromYMD(2016,8,29);
var collectionS2 = ee.ImageCollection("COPERNICUS/S2").filterDate(startDateS2,endDateS2).filterBounds(AOI).filterMetadata('CLOUDY_PIXEL_PERCENTAGE', 'less_than', 0.1);
var S2 = collectionS2.median().clip(AOI)
Map.addLayer(S2, {min:0, max: 3000, bands:"B4,B3,B2"}, 'S2');
Map.centerObject(AOI);
var s2_ndvi = S2.normalizedDifference(['B8', 'B4']).rename('NDVI')
var ndviParams = {min: -0.2, max: 0.8, palette: ['red', 'yellow', 'green']};
Map.addLayer(s2_ndvi, ndviParams, 'NDVI');
//
//TimeSeries ---------------------------------------------
var startDate = ee.Date.fromYMD(2018,1,1);
var endDate = ee.Date.fromYMD(2019,12,31);
var months = ee.List.sequence(1,12)
var years = ee.List.sequence(2018, 2019);
//Sentinel 2 < 15% clouds -----------------------------------------
var S2_nocloud = ee.ImageCollection("COPERNICUS/S2").filterDate(startDate,endDate)
.filterBounds(AOI)
.filterMetadata('CLOUDY_PIXEL_PERCENTAGE', 'less_than', 15)
var S2_NDVI_nocloud = S2_nocloud.map(function(image){
return image.normalizedDifference(['B8', 'B4']).rename('NDVI').copyProperties(image, ['system:time_start']);
})
//Chart
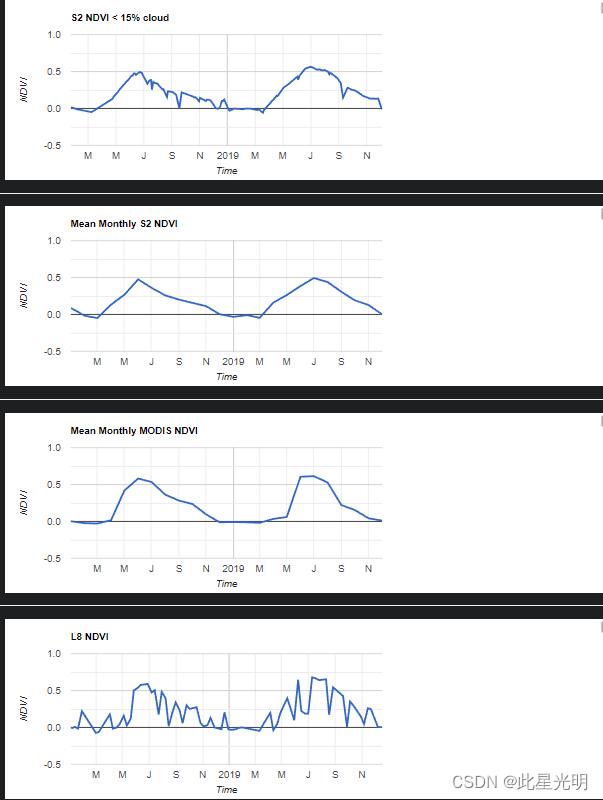
var titleS2_nocloud = {
title: 'S2 NDVI < 15% cloud',
hAxis: {title: 'Time'},
vAxis: {title: 'NDVI'},
};
var S2_chart_nocloud = ui.Chart.image.seriesByRegion({
imageCollection: S2_NDVI_nocloud,
regions: Point_1,
reducer: ee.Reducer.mean(),
band: 'NDVI',
scale: 20,
seriesProperty: 'NDVI'
}).setOptions(titleS2_nocloud)
print(S2_chart_nocloud);
// Sentinel 2 Monthly ------------------------------------------------------------
function maskS2clouds(image) {
var qa = image.select('QA60');
// Bits 10 and 11 are clouds and cirrus, respectively.
var cloudBitMask = 1 << 10;
var cirrusBitMask = 1 << 11;
// Both flags should be set to zero, indicating clear conditions.
var mask = qa.bitwiseAnd(cloudBitMask).eq(0)
.and(qa.bitwiseAnd(cirrusBitMask).eq(0));
return image.updateMask(mask).divide(10000).copyProperties(image, ['system:time_start']);
}
var S2 = ee.ImageCollection("COPERNICUS/S2").filterDate(startDate,endDate)
.filterBounds(AOI)
.map(maskS2clouds);
var Monthly_S2 = ee.ImageCollection.fromImages(
years.map(function (y) {
return months.map(function(m) {
var filtered = S2.filter(ee.Filter.calendarRange(y, y, 'year'))
.filter(ee.Filter.calendarRange(m, m, 'month'))
filtered = filtered.median()
var NDVI = filtered.expression(
'((NIR - RED) / (NIR + RED))', {
'NIR': filtered.select('B8'),
'RED': filtered.select('B4')
}).rename('NDVI');
return NDVI.set('year', y).set('month', m).set('system:time_start', ee.Date.fromYMD(y, m, 1));
});
}).flatten()
);
//Chart
var titleS2_M = {
title: 'Mean Monthly S2 NDVI',
hAxis: {title: 'Time'},
vAxis: {title: 'NDVI'},
};
var S2_chart_M = ui.Chart.image.seriesByRegion({
imageCollection: Monthly_S2,
regions: Point_1,
reducer: ee.Reducer.mean(),
band: 'NDVI',
scale: 20,
seriesProperty: 'NDVI'
}).setOptions(titleS2_M)
print(S2_chart_M);
//MODIS NDVI --------------------------------------------------------------------------
var MD_NDVI = ee.ImageCollection('MODIS/MOD09GA_006_NDVI')
.filterDate(startDate,endDate)
.filterBounds(AOI)
.select('NDVI');
var Monthly_MD = ee.ImageCollection.fromImages(
years.map(function (y) {
return months.map(function(m) {
var filtered = MD_NDVI.filter(ee.Filter.calendarRange(y, y, 'year'))
.filter(ee.Filter.calendarRange(m, m, 'month'))
filtered = filtered.median()
return filtered.set('year', y).set('month', m).set('system:time_start', ee.Date.fromYMD(y, m, 1));
});
}).flatten()
);
//Chart
var titleMD = {
title: 'Mean Monthly MODIS NDVI',
hAxis: {title: 'Time'},
vAxis: {title: 'NDVI'},
};
var MD_chart = ui.Chart.image.seriesByRegion({
imageCollection: Monthly_MD,
regions: Point_1,
reducer: ee.Reducer.mean(),
band: 'NDVI',
scale: 60,
seriesProperty: 'NDVI'
}).setOptions(titleMD)
print(MD_chart);
//Landsat 8 ------------------------------------------------------------
var L8 = ee.ImageCollection('LANDSAT/LC08/C01/T1_SR').filterDate(startDate,endDate)
.filterBounds(AOI)
var L8_NDVI = L8.map(function(image){
return image.normalizedDifference(['B5', 'B4']).rename('NDVI').copyProperties(image, ['system:time_start']);
})
//chart
var titleL8 = {
title: 'L8 NDVI',
hAxis: {title: 'Time'},
vAxis: {title: 'NDVI'},
};
var L8_chart = ui.Chart.image.seriesByRegion({
imageCollection: L8_NDVI,
regions: Point_1,
reducer: ee.Reducer.mean(),
band: 'NDVI',
scale: 30,
seriesProperty: 'NDVI'
}).setOptions(titleL8)
print(L8_chart);
// export to CSV
var export_csv = function(img){
var mon = img.get('month')
var yea = img.get('year')
var value = img.reduceRegion(ee.Reducer.mean(), Point_1, 500).get('NDVI')
var ft = ee.Feature(null, {'year': yea,
'month': mon,
'value': value});
return ft;
};
// Apply the function to each image in modisLST.
var MD_csv = Monthly_MD.map(export_csv);
Export.image.toDrive({
image: s2_ndvi,
description: 'Afework_Bibugne',
scale: 10
});
Export.table.toDrive({collection: MD_csv, selectors: 'year, month, value',folder:"Time_Series", fileFormat:"CSV"});