很多时候我们要进行长时间序列的影像时序影像图表加载,用于查看过去一段时间内的应先给变化这里我们就会用到(chart)图表分析,doySeriesByYear和doySeries两者的区别在哪里?这里我们首先要看两个函数。当我们出现加载超限的时候,我们首先可以减少我的日期,因为一个小区域内的影像也仅仅3个月就超过了1250景,所以当加载超过5000景影像的时候就无法完成其内容加载,就会体现出超限的过程。
ui.Chart.image.doySeries(imageCollection, region, regionReducer, scale, yearReducer, startDay, endDay)
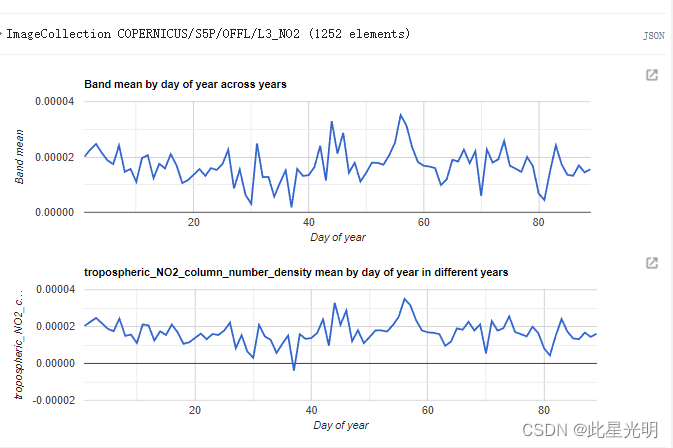
Generates a Chart from an ImageCollection. Plots derived values of each band in a region for a each day of the year.
-
X-axis: Day of year (startDay to endDay, defaults to 1 to 366).
-
Y-axis: Derived band value (reduced within the region and across years).
-
Series: Band names.
Returns a chart.