SciencePlots用于科学绘图的Matplotlib样式库

前言

  • SciencePlots包是matplotlib包的主题扩展库,所以我们必须同时拥有SciencePlots包和matplotlib包。SciencePlots包[官方地址]。(https://github.com/garrettj403/SciencePlots)
  • pip install SciencePlotspip install matplotlib
  • 使用此包还需要Latex支持,Latex下载链接。中文字体需要Noto Serif SC支持,下载链接。安装完字体后,要将matplotlib包的字体缓存更新,以win系统为例,删除C:\Users\lenovo\.matplotlib文件夹,然后重新执行import matplotlib as mpl会更新字体库。
  • 官方文档中使用plt.style.use(['science', 'no-latex', 'cjk-sc-font'])设置中文字体,我安装了'cjk-sc-font'(也就是'Noto Serif SC'字体)但是依然会报错,我使用plt.rcParams['font.sans-serif']=['Noto Serif SC']能达到相同的效果,如果有人知道怎么解决请私信我修改教程。

绘图

#加载包
import numpy as np
import pandas as pd
from plotnine import*
import seaborn as sns
from scipy import stats

import matplotlib as mpl
import matplotlib.pyplot as plt
# 中文显示问题
plt.rcParams['font.sans-serif']=['Noto Serif SC']
plt.rcParams['axes.unicode_minus'] = False

import scienceplots
plt.style.use(['science','ieee','notebook'])

# notebook嵌入图片
%matplotlib inline
# 提高分辨率
%config InlineBackend.figure_format='retina'

# 忽略警告
import warnings
warnings.filterwarnings('ignore')
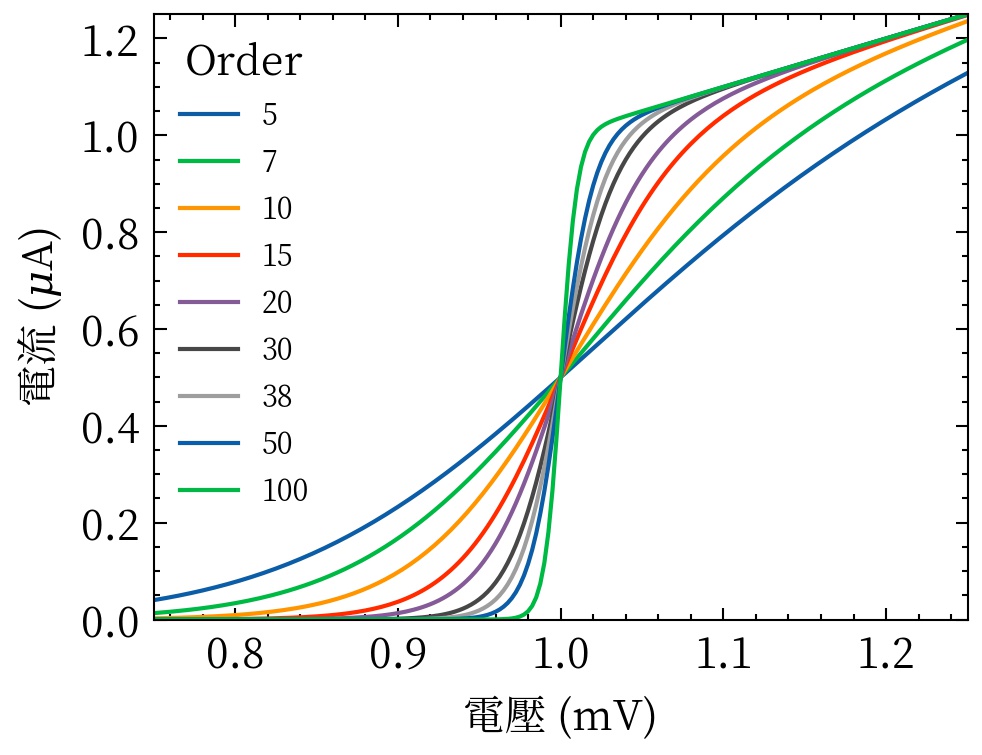
x = np.arange(1,10,0.5)
y_1 = x * 2 + 4 + x ** 2
y_2 = x * 0.5 + 3 + x ** 1.5
y_3 = x * 3.5 + 2 + x ** 3
plt.figure()
plt.plot(x, y_1)
plt.plot(x, y_2)
plt.plot(x, y_3)
plt.xlabel('时间(s)')
plt.ylabel('电力情况(k)')
plt.show()

在这里插入图片描述

官方文档展示

  • 更多主题搭配可以在这里找到。
  • plt.style.use(['science'])
    请添加图片描述
  • plt.style.use(['science', 'ieee'])
    请添加图片描述
  • plt.style.use(['science', 'notebook'])
    请添加图片描述
  • plt.style.use(['science', 'scatter'])
    请添加图片描述
  • plt.style.use(['dark_background', 'science', 'high-vis'])
    请添加图片描述
  • plt.style.use(['science', 'bright'])
    请添加图片描述
  • plt.style.use(['science', 'vibrant'])
    请添加图片描述
  • plt.style.use(['science', 'muted'])
    请添加图片描述
  • plt.style.use(['science', 'retro'])
    请添加图片描述
  • plt.style.use(['science', 'grid'])
    请添加图片描述
  • plt.style.use(['science', 'high-contrast'])
    请添加图片描述
  • plt.style.use(['science', 'light'])
    请添加图片描述
  • plt.style.use(['science', 'no-latex', 'cjk-tc-font'])
    请添加图片描述
  • plt.style.use(['science', 'no-latex', 'cjk-sc-font'])
    请添加图片描述
  • plt.style.use(['science', 'no-latex', 'cjk-jp-font'])
    请添加图片描述
  • plt.style.use(['science', 'no-latex', 'cjk-kr-font'])
    请添加图片描述
  • plt.style.use(['science', 'russian-font'])
    请添加图片描述
  • plt.style.use(['science', 'turkish-font'])
    请添加图片描述

猜你喜欢

转载自blog.csdn.net/qq_20144897/article/details/130461520