命令窗口中的指令
按住“开始”键和“R”键然后输入cmd调出 命令窗口,然后执行以下指令
gnuplot读取txt文档第一列和第二列画图
首先放出完整的命令:
gnuplot
set datafile separator ','//表示txt文档中数据的间隔是‘,’
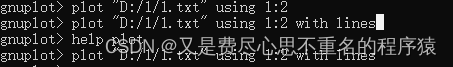
plot "D:/1/1.txt" using 1:2//用点画出的图
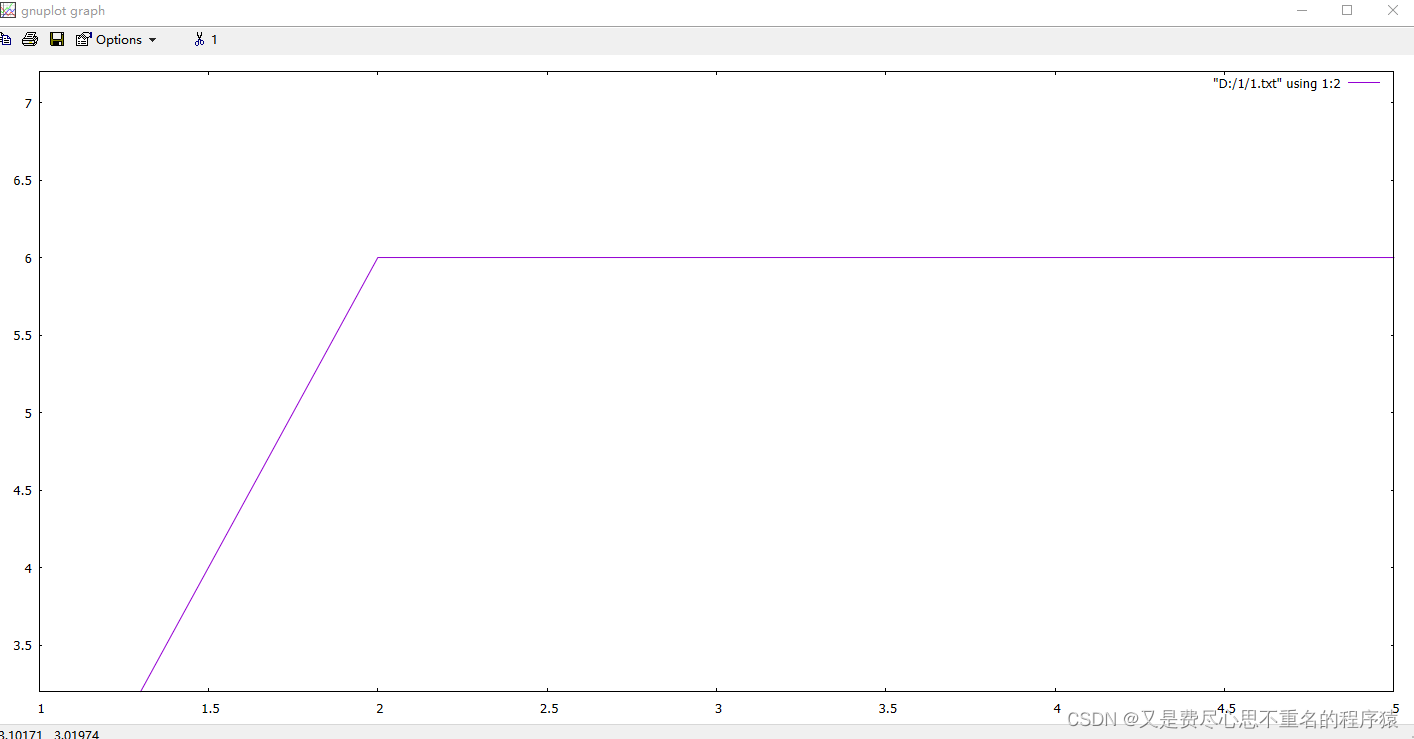
plot "D:/1/1.txt" using 1:2 with lines//用线画出的图形
txt文档图示:


想要获得某一个关键词的用法帮助:
help plot
把plot换成自己想知道的关键词即可
运行截图:
c/c++中使用示例
int main() {


	FILE* pipe = _popen("gnuplot", "w");
	//fprintf(pipe, "set arrow from 0 to 170");
	fprintf(pipe, "set datafile separator',' \n");
	fprintf(pipe, "plot 'D:/1/1.txt' using 1:2 with lines \n" );
	fprintf(pipe, "pause mouse\n");
	system("pause");
	return 0;
}