gnuplot画图
1. gnuplot下载安装
下载地址
https://pan.baidu.com/s/1NfYqBOOP7nn0JzhuqdtmVw
提取码:0468
下载完成之后,将文件解压安装在指定的文件夹中,然后复制文件的地址,将其添加到环境变量中。


gnuplot画图
在安装完软件和配置好环境变量之后就可以编辑gnuplot画图了,打开windows命令行,输入gnuplot。
gnuplot
 出现上述画面就说明软件安装成功了,输入指令开始画图,例如画一个sin(x)的图像。
gnuplot> plot sin(x)
结果如下:
 你还可以对图进行修饰,例如,我现在改变图像的颜色和线条的宽度。
gnuplot> plot sin(x) with line linetype 3 linewidth 6
设置线条颜色为3,线条的粗细为6.
 如果你不知道各种类型是什么样子的,可以输入指令test查看示例
gnuplot> test

| 画点线 | linespoints |
|---|---|
| 连线风格 | linestyle |
| 连线种类 | linetype |
| 连线粗细 | linewidth |
| 连线颜色 | linecolor |
| 点的种类 | pointtype |
| 点的大小 | pointsize |
在图中插入文字
gnuplot> set label 'sin(x)' at 0.5,0.5
gnuplot> plot sin(x) with line linetype 3 linewidth 6
 下面的命令就不一一演示了,感兴趣的同学可以自己尝试一下
- 插入箭头:
set arrow from 0.0,0.0 to 0.6,0.8
从(0.0,0.0)到(0.6,0.8)画一个箭头 - 插入坐标轴:
set xlabel ‘x’
x轴标为‘x’ - 图片的大小:
set size 0.5,0.5
长宽均为默认宽度的一半,建议用这个取值,尤其是画成ps或eps图形的时候 - 图片的位置:
set origin 0.0,0.5
设定图的最左下角的那一点在图形面板中的位置。这里图将出现在左上角。 - 画三维图:
splot ‘文件名’ u 2:4:5
以第二和第四列作为x和y坐标,第五列为z坐标。
同一张图里画多张图
gnuplot> set multiplot   %设置为多图模式
multiplot> set origin 0.0,0.5  %设置第一个图的原点的位置
multiplot> set size 0.5,0.5  %设置第一个图的大小
multiplot> plot sin(x)   %画出sin(x)
multiplot> set origin 0.5,0.5  %设置第二个图的原点的位置
multiplot> set size 0.5,0.5   %设置第二个图的大小
multiplot> plot cos(x)  %画出cos(x)
multiplot> set origin 0.0,0.0  %设置第三个图的原点的位置
multiplot> set size 0.5,0.5  %设置第三个图的大小
multiplot> plot tan(x)  %画出tan(x)
结果:

画pm 3d图
gnuplot> set pm3d  %设置pm3d模式
gnuplot> set isosamples 50,50  %设置网格点
gnuplot> splot x**2+y**2  %画三维图
结果:
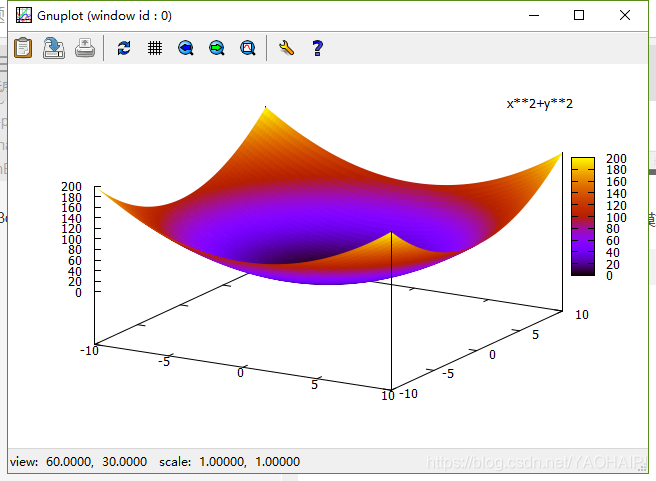
 然后再输入splot x2+y2 w pm3d 画成pm3d模式
gnuplot> splot x**2+y**2 w pm3d %画成pm3d模式
结果:
 设置视角为(0,0)将三维图投影到底面上去
gnuplot> set view 0,0  %设置视角,(0,0)将投影到底面上去
gnuplot> splot x**2+y**2 w pm3d  %重画
结果:
 最后代码如下:

