tools.cs
using System;
using System.Collections.Generic;
using System.IO;
using System.Linq;
using System.Text;
using System.Threading.Tasks;
using ZedGraph;

namespace HistoryLine
{
    class tools
    {
        static string path = @"C:\";

        string[] lines = File.ReadAllLines(path + "2.txt"); //读入所有行,放入数组

        private StreamReader sr;

        private StreamReader getStream() {
            string path = @"C:\2.txt";
            FileStream file = new FileStream(path, FileMode.Open, FileAccess.Read);
            this.sr= new StreamReader(file);
          //  StreamReader sr = new StreamReader(file);
            return this.sr;

        }
        private double GetRMS(PointPairList dayList)  //获取某天的均方根值,即有效值
        {
            double sum = 0;

            //求dayList集合中数据的均方根值
            for (int i = 0; i < dayList.Count; i++)
            {
                sum += (dayList[i].Y) * (dayList[i].Y); //求平方和
            }
            return Math.Sqrt(sum / dayList.Count);
        }


        public void getDatAll(PointPairList list, int lie)  //获取全部数据
        {
            String line = getStream().ReadLine();
            while ((line = sr.ReadLine()) != "")
            {
                string[] linesplit = line.Split(new char[] { '\t' }, StringSplitOptions.RemoveEmptyEntries);//每行数据分割
                double X = (double)new XDate((DateTime.Parse(linesplit[linesplit.Length - 2]))); //提取X点
                double Y = double.Parse(linesplit[lie]);
                list.Add(X, Y);

            }
            getStream().Close();

        }

        public void getpartdat(PointPairList list1, int lie, string starDate, string endDate)  //获取部分数据
        {
            String line = getStream().ReadLine();
            double time1 = (double)new XDate((DateTime.Parse(starDate)));
            double time2 = (double)new XDate((DateTime.Parse(endDate)));
            while ((line = sr.ReadLine()) != "")
            {
                string[] linesplit = line.Split(new char[] { '\t', ' ' }, StringSplitOptions.RemoveEmptyEntries);//每行数据分割
                string[] linesplit1 = line.Split(new char[] { '\t' }, StringSplitOptions.RemoveEmptyEntries);//每行数据分割
                double X = (double)new XDate((DateTime.Parse(linesplit[linesplit.Length - 3]))); //提取X点,时间型转成double型
                double X1 = (double)new XDate((DateTime.Parse(linesplit1[linesplit1.Length - 2]))); //提取X点,时间型转成double型

                if (X < time1)
                { }
                else if (X <= time2)
                {
                    double Y = double.Parse(linesplit[lie]);
                    list1.Add(X1, Y);
                }
                else
                {
                    break;
                }

            }
            getStream().Close();

        }


        private void sortdate(PointPairList list2)  //对一天的数据排序
        {
            for (int j = 0; j < list2.Count - 1; j++)  //冒泡排序
            {
                for (int k = 0; k < list2.Count - 1 - j; k++)
                {
                    if (list2[k].Y > list2[k + 1].Y)
                    {
                        double tmp1 = list2[k].Y;
                        list2[k].Y = list2[k + 1].Y;
                        list2[k + 1].Y = tmp1;
                    }
                }
            }

        }

        private Tuple<double,double>Exec(PointPairList list2)  //对一天的数据求最大值,最小值
        {
            double tmp = list2[0].Y;
            double tmp1 = list2[0].Y;
            for (int j = 1; j < list2.Count - 1; j++)
            {
                if(list2[j].Y> tmp)
                {
                    tmp = list2[j].Y;  //最大值
                }
                if(list2[j].Y < tmp1)
                {
                    tmp1 = list2[j].Y;  //最小值
                }
            }
            Tuple<double, double> tup = new Tuple<double, double>(tmp, tmp1);
            return tup;

        }


        public void getPeakVaule(PointPairList list, int lie)  //获取峰值数据
        {
            double X = 0;
            double Y = 0;
            double y2 = 0;

            PointPairList list2 = new PointPairList();//一天的数据
            String line;
            line = getStream().ReadLine();
            line = sr.ReadLine();
            string[] lines1 = line.Split(new char[] { '\t', ' ' }, StringSplitOptions.RemoveEmptyEntries);//第二行解析
            XDate x1 = new XDate((DateTime.Parse(lines1[lines1.Length - 3])));
            double tmp = (double)x1; //提取第二行的X点时间点
            Y = double.Parse(lines1[lie]);
            list2.Add(tmp, Y);
            while ((line = sr.ReadLine()) != "")
            {
                string[] linesplit = line.Split(new char[] { '\t', ' ' }, StringSplitOptions.RemoveEmptyEntries);//每行数据分割
                XDate x = new XDate((DateTime.Parse(linesplit[linesplit.Length - 3])));
                X = (double)x; //提取X点
                Y = double.Parse(linesplit[lie]); //提取Y点
                if (X == tmp)
                {

                    list2.Add(X, Y);
                }
                if (X != tmp)
                {

                    //峰值
                    y2 = Exec(list2).Item1;
                    list.Add(tmp, y2);
                    list2.Clear();
                    list2.Add(X, Y);
                    tmp = X;         //tmp值改变

                }

            }
            //最后一天的峰值
            y2 = Exec(list2).Item1;
            list.Add(tmp, y2);
            list2.Clear();

        }

        public void getBeatValue(PointPairList list, int lie)  //获取跳动值
        {
            PointPairList list2 = new PointPairList();//一天的数据
            double X, Y, y2;
            String line;
            line = getStream().ReadLine();
            line = sr.ReadLine();
            string[] lines1 = line.Split(new char[] { '\t', ' ' }, StringSplitOptions.RemoveEmptyEntries);//第二行解析
            XDate x1 = new XDate((DateTime.Parse(lines1[lines1.Length - 3])));
            double tmp = (double)x1; //提取第二行的X点时间点
            Y = double.Parse(lines1[lie]);
            list2.Add(tmp, Y);
            while ((line = sr.ReadLine()) != "")
            {
                string[] linesplit = line.Split(new char[] { '\t', ' ' }, StringSplitOptions.RemoveEmptyEntries);//每行数据分割
                XDate x = new XDate((DateTime.Parse(linesplit[linesplit.Length - 3])));
                X = (double)x; //提取X点
                Y = double.Parse(linesplit[lie]); //提取Y点
                if (X == tmp)
                {

                    list2.Add(X, Y);
                }
                if (X != tmp)
                {

                    //跳动值
                    y2 = Exec(list2).Item1 - Exec(list2).Item2;
                    list.Add(tmp, y2);
                    list2.Clear();
                    list2.Add(X, Y);
                    tmp = X;         //tmp值改变

                }

            }
            //最后一天的跳动值
            y2 = Exec(list2).Item1 - Exec(list2).Item2;
            list.Add(tmp, y2);
            list2.Clear();

        }

        public void getEffectValue(PointPairList list, int lie) //获取有效值数据
        {
            PointPairList list2 = new PointPairList();//一天的数据
            double X, Y, y2;
            String line;
            line = getStream().ReadLine();
            line = sr.ReadLine();
            string[] lines1 = line.Split(new char[] { '\t', ' ' }, StringSplitOptions.RemoveEmptyEntries);//第二行解析
            XDate x1 = new XDate((DateTime.Parse(lines1[lines1.Length - 3])));
            double tmp = (double)x1; //提取第二行的X点时间点
            Y = double.Parse(lines1[lie]);
            list2.Add(tmp, Y);
            while ((line = sr.ReadLine()) != "")
            {
                string[] linesplit = line.Split(new char[] { '\t', ' ' }, StringSplitOptions.RemoveEmptyEntries);//每行数据分割
                XDate x = new XDate((DateTime.Parse(linesplit[linesplit.Length - 3])));
                X = (double)x; //提取X点
                Y = double.Parse(linesplit[lie]); //提取Y点
                if (X == tmp)
                {

                    list2.Add(X, Y);
                }
                if (X != tmp)
                {

                    //有效值
                    y2 = GetRMS(list2);
                    list.Add(tmp, y2);
                    list2.Clear();
                    list2.Add(X, Y);
                    tmp = X;         //tmp值改变

                }

            }
            //最后一天的有效值
            y2 = GetRMS(list2);
            list.Add(tmp, y2);
            list2.Clear();
        }

    }
}
CreatGrap.cs
using System;
using System.Collections.Generic;
using System.Drawing;
using System.Linq;
using System.Text;
using System.Threading.Tasks;
using ZedGraph;

namespace HistoryLine
{
    class CreatGrap
    {
        GraphPane myPane;
        public GraphPane getPane()
        {
            return this.myPane;
        }


        public void CreatGraphics(ZedGraphControl zgc, PointPairList list1, string format, DateUnit majorunit)
        {
            myPane = zgc.GraphPane;
            myPane.CurveList.Clear(); //将面板上的控件清除
            myPane.GraphObjList.Clear(); //标题、x,y轴标签设置之前清除

            zgc.IsEnableVZoom = false;  //垂直轴不缩放
            zgc.IsShowPointValues = true;   //显示点的坐标
            myPane.XAxis.Scale.MajorStepAuto = true;  //自动设置大刻度步长
            myPane.XAxis.Scale.MinorStepAuto = true;   //自动设置小刻度步长

            //myPane.XAxis.Scale.Format = "yyyy-MM-dd "; //横轴格式
            myPane.XAxis.Scale.Format = format; //横轴格式
            //myPane.XAxis.Scale.MajorUnit = DateUnit.Day;  //大刻度步长单位
            myPane.XAxis.Scale.MajorUnit = majorunit;  //大刻度步长单位
            myPane.XAxis.Type = AxisType.DateAsOrdinal;   //数据显示方式
            myPane.XAxis.MajorGrid.IsVisible = true; //设置虚线
            myPane.XAxis.MajorGrid.Color = Color.Green;  //虚线的颜色

            zgc.GraphPane.CurveList.Clear();
            LineItem myCurve = myPane.AddCurve("", list1, Color.Red, SymbolType.None);

            //填充图表颜色
            // myPane.Fill = new Fill(Color.White, Color.FromArgb(200, 200, 255), 45.0f);

            //画到zedGraphControl1控件中,此句必加

            zgc.AxisChange();


        }


    }
}
框架主程序
using System;
using System.Collections.Generic;
using System.ComponentModel;
using System.Data;
using System.Drawing;
using System.IO;
using System.Linq;
using System.Text;
using System.Threading.Tasks;
using System.Windows.Forms;
using ZedGraph;
namespace HistoryLine
{
public partial class Form2 : Form
{
int row;//列数
CreatGrap graphic = new CreatGrap();//创建画图类对象
tools tool = new tools();//创建工具类对象
public Form2()
{
InitializeComponent();
}
private void empty()
{
//zedGraphControl1.GraphPane.XAxis.Title.Text = "X Axis"; //X轴标题
//zedGraphControl1.GraphPane.YAxis.Title.Text = "Y Axis";
//zedGraphControl1.GraphPane.Title.Text = "Title";
//zedGraphControl1.GraphPane.CurveList.Clear();
//zedGraphControl1.GraphPane.GraphObjList.Clear();
//zedGraphControl1.AxisChange();
//zedGraphControl1.Refresh();
comboBox1.Items.Clear();
comboBox1.Text = "请选择曲线类型";
}
private void zedGraphControl1_Load(object sender, EventArgs e)
{
}
private void Form1_Load(object sender, EventArgs e)
{
// comboBox1.SelectedIndex =0;//默认显示第一个选择项
}
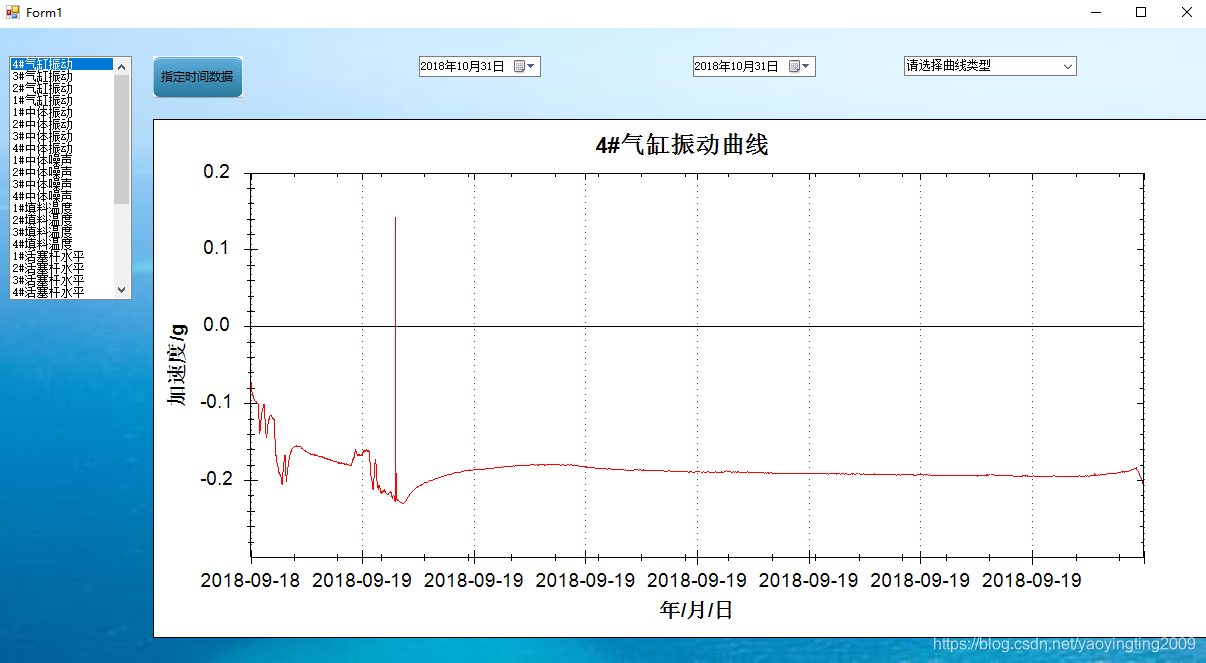
private void getAllDate(int row)
{
PointPairList list1 = new PointPairList();
tool.getDatAll(list1, row); //获取第n列的全部数据
graphic.CreatGraphics(zedGraphControl1, list1, "yyyy-MM-dd ", DateUnit.Day);
graphic.getPane().XAxis.Title.Text = "年/月/日"; //X轴标题
switch (row)
{
case 0:
graphic.getPane().Title.Text = "4#气缸振动曲线"; //标题
graphic.getPane().YAxis.Title.Text = "加速度/g"; //Y轴标题
break;
case 1:
graphic.getPane().Title.Text = "3#气缸振动曲线"; //标题
graphic.getPane().YAxis.Title.Text = "加速度/g"; //Y轴标题
break;
case 2:
graphic.getPane().Title.Text = "2#气缸振动曲线"; //标题
graphic.getPane().YAxis.Title.Text = "加速度/g"; //Y轴标题
break;
case 3:
graphic.getPane().Title.Text = "1#气缸振动曲线"; //标题
graphic.getPane().YAxis.Title.Text = "加速度/g"; //Y轴标题
break;
case 4:
graphic.getPane().Title.Text = "1#中体振动曲线"; //标题
graphic.getPane().YAxis.Title.Text = "加速度/g"; //Y轴标题
break;
case 5:
graphic.getPane().Title.Text = "2#中体振动曲线"; //标题
graphic.getPane().YAxis.Title.Text = "加速度/g"; //Y轴标题
break;
case 6:
graphic.getPane().Title.Text = "3#中体振动曲线"; //标题
graphic.getPane().YAxis.Title.Text = "加速度/g"; //Y轴标题
break;
case 7:
graphic.getPane().Title.Text = "4#中体振动曲线"; //标题
graphic.getPane().YAxis.Title.Text = "加速度/g"; //Y轴标题
break;
case 8:
graphic.getPane().Title.Text = "1#中体噪声曲线"; //标题
graphic.getPane().YAxis.Title.Text = "声压/Pa"; //Y轴标题
break;
case 9:
graphic.getPane().Title.Text = "2#中体噪声曲线"; //标题
graphic.getPane().YAxis.Title.Text = "声压/Pa"; //Y轴标题
break;
case 10:
graphic.getPane().Title.Text = "3#中体噪声曲线"; //标题
graphic.getPane().YAxis.Title.Text = "声压/Pa"; //Y轴标题
break;
case 11:
graphic.getPane().Title.Text = "4#中体噪声曲线"; //标题
graphic.getPane().YAxis.Title.Text = "声压/Pa"; //Y轴标题
break;
case 12:
graphic.getPane().Title.Text = "1#填料温度曲线"; //标题
graphic.getPane().YAxis.Title.Text = "温度/℃"; //Y轴标题
break;
case 13:
graphic.getPane().Title.Text = "2#填料温度曲线"; //标题
graphic.getPane().YAxis.Title.Text = "温度/℃"; //Y轴标题
break;
case 14:
graphic.getPane().Title.Text = "3#填料温度曲线"; //标题
graphic.getPane().YAxis.Title.Text = "温度/℃"; //Y轴标题
break;
case 15:
graphic.getPane().Title.Text = "4#填料温度曲线"; //标题
graphic.getPane().YAxis.Title.Text = "温度/℃"; //Y轴标题
break;
case 16:
graphic.getPane().Title.Text = "1#活塞杆水平沉降位移曲线"; //标题
graphic.getPane().YAxis.Title.Text = "位移/mm"; //Y轴标题
break;
case 17:
graphic.getPane().Title.Text = "2#活塞杆水平沉降位移曲线"; //标题
graphic.getPane().YAxis.Title.Text = "位移/mm"; //Y轴标题
break;
case 18:
graphic.getPane().Title.Text = "3#活塞杆水平沉降位移曲线"; //标题
graphic.getPane().YAxis.Title.Text = "位移/mm"; //Y轴标题
break;
case 19:
graphic.getPane().Title.Text = "4#活塞杆水平沉降位移曲线"; //标题
graphic.getPane().YAxis.Title.Text = "位移/mm"; //Y轴标题
break;
case 20:
graphic.getPane().Title.Text = "1#活塞杆垂直沉降位移曲线"; //标题
graphic.getPane().YAxis.Title.Text = "位移/mm"; //Y轴标题
break;
case 21:
graphic.getPane().Title.Text = "2#活塞杆垂直沉降位移曲线"; //标题
graphic.getPane().YAxis.Title.Text = "位移/mm"; //Y轴标题
break;
case 22:
graphic.getPane().Title.Text = "3#活塞杆垂直沉降位移曲线"; //标题
graphic.getPane().YAxis.Title.Text = "位移/mm"; //Y轴标题
break;
case 23:
graphic.getPane().Title.Text = "4#活塞杆垂直沉降位移曲线"; //标题
graphic.getPane().YAxis.Title.Text = "位移/mm"; //Y轴标题
break;
case 24:
graphic.getPane().Title.Text = "1#曲轴水平振动曲线"; //标题
graphic.getPane().YAxis.Title.Text = "加速度/g"; //Y轴标题
break;
case 25:
graphic.getPane().Title.Text = "2#曲轴水平振动曲线"; //标题
graphic.getPane().YAxis.Title.Text = "加速度/g"; //Y轴标题
break;
case 26:
graphic.getPane().Title.Text = "1#曲轴箱振动曲线"; //标题
graphic.getPane().YAxis.Title.Text = "加速度/g"; //Y轴标题
break;
case 27:
graphic.getPane().Title.Text = "1#曲轴垂直振动曲线"; //标题
graphic.getPane().YAxis.Title.Text = "加速度/g"; //Y轴标题
break;
case 28:
graphic.getPane().Title.Text = "2#曲轴垂直振动曲线"; //标题
graphic.getPane().YAxis.Title.Text = "加速度/g"; //Y轴标题
break;
case 29:
graphic.getPane().Title.Text = "2#曲轴箱振动曲线"; //标题
graphic.getPane().YAxis.Title.Text = "加速度/g"; //Y轴标题
break;
case 30:
graphic.getPane().Title.Text = "转速报警曲线"; //标题
graphic.getPane().YAxis.Title.Text = "转速"; //Y轴标题
break;
case 31:
graphic.getPane().Title.Text = "相位报警曲线"; //标题
graphic.getPane().YAxis.Title.Text = "相位"; //Y轴标题
break;
default: break;
}
zedGraphControl1.Refresh();
}
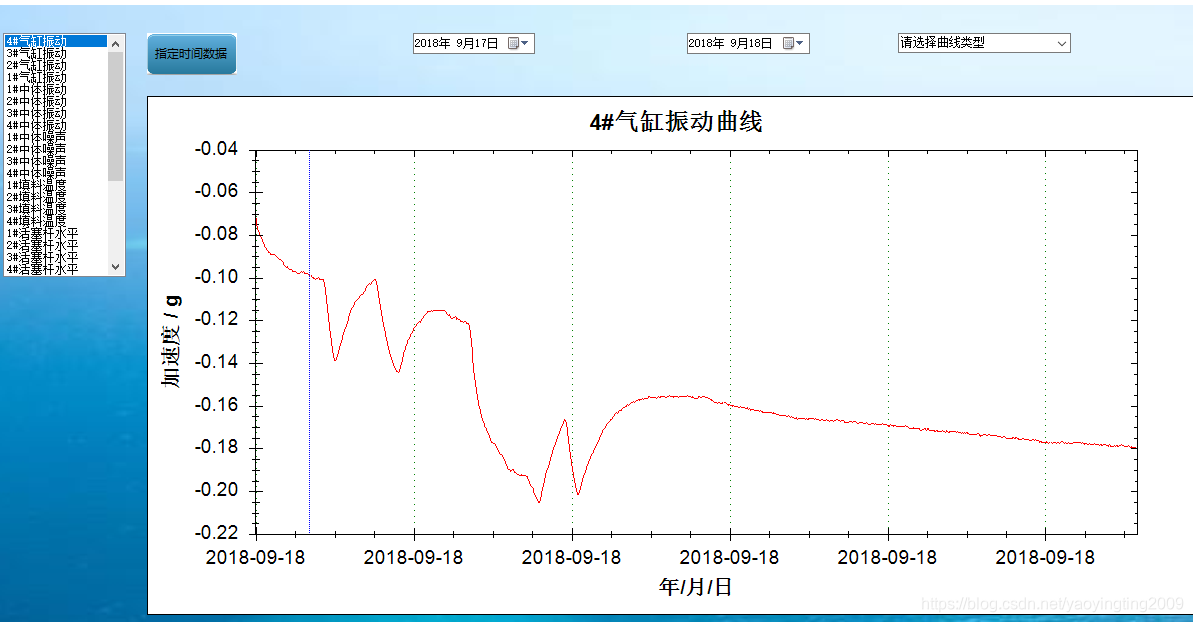
private void button1_Click(object sender, EventArgs e) //显示部分数据
{
PointPairList list1 = new PointPairList();
string starDate = dateTimePicker1.Value.ToString("yyyy-MM-dd");
string endDate = dateTimePicker2.Value.ToString("yyyy-MM-dd");
tool.getpartdat(list1, row, starDate, endDate); //获取第n列的部分数据
graphic.CreatGraphics(zedGraphControl1, list1, "yyyy-MM-dd ", DateUnit.Day);
graphic.getPane().XAxis.Title.Text = "年/月/日"; //X轴标题
switch (row)
{
case 0:
graphic.getPane().Title.Text = "4#气缸振动曲线"; //标题
graphic.getPane().YAxis.Title.Text = "加速度 / g"; //Y轴标题
break;
case 1:
graphic.getPane().Title.Text = "3#气缸振动曲线"; //标题
graphic.getPane().YAxis.Title.Text = "加速度/g"; //Y轴标题
break;
case 2:
graphic.getPane().Title.Text = "2#气缸振动曲线"; //标题
graphic.getPane().YAxis.Title.Text = "加速度/g"; //Y轴标题
break;
case 3:
graphic.getPane().Title.Text = "1#气缸振动曲线"; //标题
graphic.getPane().YAxis.Title.Text = "加速度/g"; //Y轴标题
break;
case 4:
graphic.getPane().Title.Text = "1#中体振动曲线"; //标题
graphic.getPane().YAxis.Title.Text = "加速度/g"; //Y轴标题
break;
case 5:
graphic.getPane().Title.Text = "2#中体振动曲线"; //标题
graphic.getPane().YAxis.Title.Text = "加速度/g"; //Y轴标题
break;
case 6:
graphic.getPane().Title.Text = "3#中体振动曲线"; //标题
graphic.getPane().YAxis.Title.Text = "加速度/g"; //Y轴标题
break;
case 7:
graphic.getPane().Title.Text = "4#中体振动曲线"; //标题
graphic.getPane().YAxis.Title.Text = "加速度/g"; //Y轴标题
break;
case 8:
graphic.getPane().Title.Text = "1#中体噪声曲线"; //标题
graphic.getPane().YAxis.Title.Text = "声压/Pa"; //Y轴标题
break;
case 9:
graphic.getPane().Title.Text = "2#中体噪声曲线"; //标题
graphic.getPane().YAxis.Title.Text = "声压/Pa"; //Y轴标题
break;
case 10:
graphic.getPane().Title.Text = "3#中体噪声曲线"; //标题
graphic.getPane().YAxis.Title.Text = "声压/Pa"; //Y轴标题
break;
case 11:
graphic.getPane().Title.Text = "4#中体噪声曲线"; //标题
graphic.getPane().YAxis.Title.Text = "声压/Pa"; //Y轴标题
break;
case 12:
graphic.getPane().Title.Text = "1#填料温度曲线"; //标题
graphic.getPane().YAxis.Title.Text = "温度/℃"; //Y轴标题
break;
case 13:
graphic.getPane().Title.Text = "2#填料温度曲线"; //标题
graphic.getPane().YAxis.Title.Text = "温度/℃"; //Y轴标题
break;
case 14:
graphic.getPane().Title.Text = "3#填料温度曲线"; //标题
graphic.getPane().YAxis.Title.Text = "温度/℃"; //Y轴标题
break;
case 15:
graphic.getPane().Title.Text = "4#填料温度曲线"; //标题
graphic.getPane().YAxis.Title.Text = "温度/℃"; //Y轴标题
break;
case 16:
graphic.getPane().Title.Text = "1#活塞杆水平沉降位移曲线"; //标题
graphic.getPane().YAxis.Title.Text = "位移/mm"; //Y轴标题
break;
case 17:
graphic.getPane().Title.Text = "2#活塞杆水平沉降位移曲线"; //标题
graphic.getPane().YAxis.Title.Text = "位移/mm"; //Y轴标题
break;
case 18:
graphic.getPane().Title.Text = "3#活塞杆水平沉降位移曲线"; //标题
graphic.getPane().YAxis.Title.Text = "位移/mm"; //Y轴标题
break;
case 19:
graphic.getPane().Title.Text = "4#活塞杆水平沉降位移曲线"; //标题
graphic.getPane().YAxis.Title.Text = "位移/mm"; //Y轴标题
break;
case 20:
graphic.getPane().Title.Text = "1#活塞杆垂直沉降位移曲线"; //标题
graphic.getPane().YAxis.Title.Text = "位移/mm"; //Y轴标题
break;
case 21:
graphic.getPane().Title.Text = "2#活塞杆垂直沉降位移曲线"; //标题
graphic.getPane().YAxis.Title.Text = "位移/mm"; //Y轴标题
break;
case 22:
graphic.getPane().Title.Text = "3#活塞杆垂直沉降位移曲线"; //标题
graphic.getPane().YAxis.Title.Text = "位移/mm"; //Y轴标题
break;
case 23:
graphic.getPane().Title.Text = "4#活塞杆垂直沉降位移曲线"; //标题
graphic.getPane().YAxis.Title.Text = "位移/mm"; //Y轴标题
break;
case 24:
graphic.getPane().Title.Text = "1#曲轴水平振动曲线"; //标题
graphic.getPane().YAxis.Title.Text = "加速度/g"; //Y轴标题
break;
case 25:
graphic.getPane().Title.Text = "2#曲轴水平振动曲线"; //标题
graphic.getPane().YAxis.Title.Text = "加速度/g"; //Y轴标题
break;
case 26:
graphic.getPane().Title.Text = "1#曲轴箱振动曲线"; //标题
graphic.getPane().YAxis.Title.Text = "加速度/g"; //Y轴标题
break;
case 27:
graphic.getPane().Title.Text = "1#曲轴垂直振动曲线"; //标题
graphic.getPane().YAxis.Title.Text = "加速度/g"; //Y轴标题
break;
case 28:
graphic.getPane().Title.Text = "2#曲轴垂直振动曲线"; //标题
graphic.getPane().YAxis.Title.Text = "加速度/g"; //Y轴标题
break;
case 29:
graphic.getPane().Title.Text = "2#曲轴箱振动曲线"; //标题
graphic.getPane().YAxis.Title.Text = "加速度/g"; //Y轴标题
break;
case 30:
graphic.getPane().Title.Text = "转速报警曲线"; //标题
graphic.getPane().YAxis.Title.Text = "转速"; //Y轴标题
break;
case 31:
graphic.getPane().Title.Text = "相位报警曲线"; //标题
graphic.getPane().YAxis.Title.Text = "相位"; //Y轴标题
break;
default: break;
}
zedGraphControl1.Refresh();
}
private void zedGraphControl1_MouseMove(object sender, MouseEventArgs e) //画竖线
{
Graphics gc = zedGraphControl1.CreateGraphics();
Pen pen = new Pen(Color.Blue);
pen.DashStyle = System.Drawing.Drawing2D.DashStyle.Dot;
RectangleF rect = zedGraphControl1.GraphPane.Chart.Rect;
//确保在画图区域
if (rect.Contains(e.Location))
{
zedGraphControl1.Refresh();
gc.DrawLine(pen, e.X, rect.Top, e.X, rect.Bottom);
}
}
private void comboBox1_SelectedIndexChanged(object sender, EventArgs e)
{
PointPairList list1 = new PointPairList();
switch (row)
{
case 0:
//"4#气缸振动曲线"
if (comboBox1.SelectedIndex == 0)
{
tool.getEffectValue(list1, row);//获取第n列的有效值数据
graphic.CreatGraphics(zedGraphControl1, list1, "yyyy-MM-dd ", DateUnit.Day);
graphic.getPane().Title.Text = "4#气缸振动有效值曲线"; //标题
graphic.getPane().YAxis.Title.Text = "加速度有效值/g";
}
if (comboBox1.SelectedIndex == 1)
{
tool.getPeakVaule(list1, row);//获取第n列的峰值数据
graphic.CreatGraphics(zedGraphControl1, list1, "yyyy-MM-dd ", DateUnit.Day);
graphic.getPane().Title.Text = "4#气缸振动峰值曲线"; //标题
graphic.getPane().YAxis.Title.Text = "加速度峰值/g";
}
break;
case 1:
//"3#气缸振动曲线"
if (comboBox1.SelectedIndex == 0)
{
tool.getEffectValue(list1, row);//获取第n列的有效值数据
graphic.CreatGraphics(zedGraphControl1, list1, "yyyy-MM-dd ", DateUnit.Day);
graphic.getPane().Title.Text = "3#气缸振动有效值曲线"; //标题
graphic.getPane().YAxis.Title.Text = "加速度有效值/g";
}
if (comboBox1.SelectedIndex == 1)
{
tool.getPeakVaule(list1, row);//获取第n列的峰值数据
graphic.CreatGraphics(zedGraphControl1, list1, "yyyy-MM-dd ", DateUnit.Day);
graphic.getPane().Title.Text = "3#气缸振动峰值曲线"; //标题
graphic.getPane().YAxis.Title.Text = "加速度峰值/g";
}
break;
case 2:
//"2#气缸振动曲线"
if (comboBox1.SelectedIndex == 0)
{
tool.getEffectValue(list1, row);//获取第n列的有效值数据
graphic.CreatGraphics(zedGraphControl1, list1, "yyyy-MM-dd ", DateUnit.Day);
graphic.getPane().Title.Text = "2#气缸振动有效值曲线"; //标题
graphic.getPane().YAxis.Title.Text = "加速度有效值/g";
}
if (comboBox1.SelectedIndex == 1)
{
tool.getPeakVaule(list1, row);//获取第n列的峰值数据
graphic.CreatGraphics(zedGraphControl1, list1, "yyyy-MM-dd ", DateUnit.Day);
graphic.getPane().Title.Text = "2#气缸振动峰值曲线"; //标题
graphic.getPane().YAxis.Title.Text = "加速度峰值/g";
}
break;
case 3:
//"1#气缸振动曲线"
if (comboBox1.SelectedIndex == 0)
{
tool.getEffectValue(list1, row);//获取第n列的有效值数据
graphic.CreatGraphics(zedGraphControl1, list1, "yyyy-MM-dd ", DateUnit.Day);
graphic.getPane().Title.Text = "1#气缸振动有效值曲线"; //标题
graphic.getPane().YAxis.Title.Text = "加速度有效值/g";
}
if (comboBox1.SelectedIndex == 1)
{
tool.getPeakVaule(list1, row);//获取第n列的峰值数据
graphic.CreatGraphics(zedGraphControl1, list1, "yyyy-MM-dd ", DateUnit.Day);
graphic.getPane().Title.Text = "1#气缸振动峰值曲线"; //标题
graphic.getPane().YAxis.Title.Text = "加速度峰值/g";
}
break;
case 4:
//"1#中体振动曲线";
//PointPairList list1 = new PointPairList();
if (comboBox1.SelectedIndex == 0)
{
tool.getEffectValue(list1, row);//获取第n列的有效值数据
graphic.CreatGraphics(zedGraphControl1, list1, "yyyy-MM-dd ", DateUnit.Day);
graphic.getPane().Title.Text = "1#中体振动有效值曲线"; //标题
graphic.getPane().YAxis.Title.Text = "加速度有效值/g";
}
if (comboBox1.SelectedIndex == 1)
{
tool.getPeakVaule(list1, row);//获取第n列的峰值数据
graphic.CreatGraphics(zedGraphControl1, list1, "yyyy-MM-dd ", DateUnit.Day);
graphic.getPane().Title.Text = "1#中体振动峰值曲线"; //标题
graphic.getPane().YAxis.Title.Text = "加速度峰值/g";
}
break;
case 5:
//"2#中体振动曲线"
if (comboBox1.SelectedIndex == 0)
{
tool.getEffectValue(list1, row);//获取第n列的有效值数据
graphic.CreatGraphics(zedGraphControl1, list1, "yyyy-MM-dd ", DateUnit.Day);
graphic.getPane().Title.Text = "2#中体振动有效值曲线"; //标题
graphic.getPane().YAxis.Title.Text = "加速度有效值/g";
}
if (comboBox1.SelectedIndex == 1)
{
tool.getPeakVaule(list1, row);//获取第n列的峰值数据
graphic.CreatGraphics(zedGraphControl1, list1, "yyyy-MM-dd ", DateUnit.Day);
graphic.getPane().Title.Text = "2#中体振动峰值曲线"; //标题
graphic.getPane().YAxis.Title.Text = "加速度峰值/g";
}
break;
case 6:
//"3#中体振动曲线"
if (comboBox1.SelectedIndex == 0)
{
tool.getEffectValue(list1, row);//获取第n列的有效值数据
graphic.CreatGraphics(zedGraphControl1, list1, "yyyy-MM-dd ", DateUnit.Day);
graphic.getPane().Title.Text = "3#中体振动有效值曲线"; //标题
graphic.getPane().YAxis.Title.Text = "加速度有效值/g";
}
if (comboBox1.SelectedIndex == 1)
{
tool.getPeakVaule(list1, row);//获取第n列的峰值数据
graphic.CreatGraphics(zedGraphControl1, list1, "yyyy-MM-dd ", DateUnit.Day);
graphic.getPane().Title.Text = "3#中体振动峰值曲线"; //标题
graphic.getPane().YAxis.Title.Text = "加速度峰值/g";
}
break;
case 7:
//"4#中体振动曲线"
if (comboBox1.SelectedIndex == 0)
{
tool.getEffectValue(list1, row);//获取第n列的有效值数据
graphic.CreatGraphics(zedGraphControl1, list1, "yyyy-MM-dd ", DateUnit.Day);
graphic.getPane().Title.Text = "4#中体振动有效值曲线"; //标题
graphic.getPane().YAxis.Title.Text = "加速度有效值/g";
}
if (comboBox1.SelectedIndex == 1)
{
tool.getPeakVaule(list1, row);//获取第n列的峰值数据
graphic.CreatGraphics(zedGraphControl1, list1, "yyyy-MM-dd ", DateUnit.Day);
graphic.getPane().Title.Text = "4#中体振动峰值曲线"; //标题
graphic.getPane().YAxis.Title.Text = "加速度峰值/g";
}
break;
case 8:
//"1#中体噪声曲线"
if (comboBox1.SelectedIndex == 0)
{
tool.getEffectValue(list1, row);//获取第n列的有效值数据
graphic.CreatGraphics(zedGraphControl1, list1, "yyyy-MM-dd ", DateUnit.Day);
graphic.getPane().Title.Text = "1#中体噪声有效值曲线"; //标题
graphic.getPane().YAxis.Title.Text = "声压有效值/Pa";
}
if (comboBox1.SelectedIndex == 1)
{
tool.getPeakVaule(list1, row);//获取第n列的峰值数据
graphic.CreatGraphics(zedGraphControl1, list1, "yyyy-MM-dd ", DateUnit.Day);
graphic.getPane().Title.Text = "1#中体噪声峰值曲线"; //标题
graphic.getPane().YAxis.Title.Text = "声压峰值/Pa";
}
break;
case 9:
//"2#中体噪声曲线"
if (comboBox1.SelectedIndex == 0)
{
tool.getEffectValue(list1, row);//获取第n列的有效值数据
graphic.CreatGraphics(zedGraphControl1, list1, "yyyy-MM-dd ", DateUnit.Day);
graphic.getPane().Title.Text = "2#中体噪声有效值曲线"; //标题
graphic.getPane().YAxis.Title.Text = "声压有效值/Pa";
}
if (comboBox1.SelectedIndex == 1)
{
tool.getPeakVaule(list1, row);//获取第n列的峰值数据
graphic.CreatGraphics(zedGraphControl1, list1, "yyyy-MM-dd ", DateUnit.Day);
graphic.getPane().Title.Text = "2#中体噪声峰值曲线"; //标题
graphic.getPane().YAxis.Title.Text = "声压峰值/Pa";
}
break;
case 10:
//"3#中体噪声曲线"
if (comboBox1.SelectedIndex == 0)
{
tool.getEffectValue(list1, row);//获取第n列的有效值数据
graphic.CreatGraphics(zedGraphControl1, list1, "yyyy-MM-dd ", DateUnit.Day);
graphic.getPane().Title.Text = "3#中体噪声有效值曲线"; //标题
graphic.getPane().YAxis.Title.Text = "声压有效值/Pa";
}
if (comboBox1.SelectedIndex == 1)
{
tool.getPeakVaule(list1, row);//获取第n列的峰值数据
graphic.CreatGraphics(zedGraphControl1, list1, "yyyy-MM-dd ", DateUnit.Day);
graphic.getPane().Title.Text = "3#中体噪声峰值曲线"; //标题
graphic.getPane().YAxis.Title.Text = "声压峰值/Pa";
}
break;
case 11:
//"4#中体噪声曲线"
if (comboBox1.SelectedIndex == 0)
{
tool.getEffectValue(list1, row);//获取第n列的有效值数据
graphic.CreatGraphics(zedGraphControl1, list1, "yyyy-MM-dd ", DateUnit.Day);
graphic.getPane().Title.Text = "4#中体噪声有效值曲线"; //标题
graphic.getPane().YAxis.Title.Text = "声压有效值/Pa";
}
if (comboBox1.SelectedIndex == 1)
{
tool.getPeakVaule(list1, row);//获取第n列的峰值数据
graphic.CreatGraphics(zedGraphControl1, list1, "yyyy-MM-dd ", DateUnit.Day);
graphic.getPane().Title.Text = "4#中体噪声峰值曲线"; //标题
graphic.getPane().YAxis.Title.Text = "声压峰值/Pa";
}
break;
case 12:
//"1#填料温度曲线"
break;
case 13:
//"2#填料温度曲线"
break;
case 14:
//"3#填料温度曲线"
break;
case 15:
//"4#填料温度曲线"
break;
case 16:
//"1#活塞杆水平沉降位移曲线"
if (comboBox1.SelectedIndex == 0)
{
tool.getBeatValue(list1, row);//获取第n列的跳动数据
graphic.CreatGraphics(zedGraphControl1, list1, "yyyy-MM-dd ", DateUnit.Day);
graphic.getPane().Title.Text = "1#活塞杆水平沉降位移跳动曲线"; //标题
graphic.getPane().YAxis.Title.Text = "跳动/mm";
}
if (comboBox1.SelectedIndex == 1)
{
tool.getPeakVaule(list1, row);//获取第n列的峰值数据
graphic.CreatGraphics(zedGraphControl1, list1, "yyyy-MM-dd ", DateUnit.Day);
graphic.getPane().Title.Text = "1#活塞杆水平沉降位移峰值曲线"; //标题
graphic.getPane().YAxis.Title.Text = "峰值/mm";
}
break;
case 17:
//"2#活塞杆水平沉降位移曲线"
if (comboBox1.SelectedIndex == 0)
{
tool.getBeatValue(list1, row);//获取第n列的跳动数据
graphic.CreatGraphics(zedGraphControl1, list1, "yyyy-MM-dd ", DateUnit.Day);
graphic.getPane().Title.Text = "2#活塞杆水平沉降位移跳动曲线"; //标题
graphic.getPane().YAxis.Title.Text = "跳动/mm";
}
if (comboBox1.SelectedIndex == 1)
{
tool.getPeakVaule(list1, row);//获取第n列的峰值数据
graphic.CreatGraphics(zedGraphControl1, list1, "yyyy-MM-dd ", DateUnit.Day);
graphic.getPane().Title.Text = "2#活塞杆水平沉降位移峰值曲线"; //标题
graphic.getPane().YAxis.Title.Text = "峰值/mm";
}
break;
case 18:
// "3#活塞杆水平沉降位移曲线"
if (comboBox1.SelectedIndex == 0)
{
tool.getBeatValue(list1, row);//获取第n列的跳动数据
graphic.CreatGraphics(zedGraphControl1, list1, "yyyy-MM-dd ", DateUnit.Day);
graphic.getPane().Title.Text = "3#活塞杆水平沉降位移跳动曲线"; //标题
graphic.getPane().YAxis.Title.Text = "跳动/mm";
}
if (comboBox1.SelectedIndex == 1)
{
tool.getPeakVaule(list1, row);//获取第n列的峰值数据
graphic.CreatGraphics(zedGraphControl1, list1, "yyyy-MM-dd ", DateUnit.Day);
graphic.getPane().Title.Text = "3#活塞杆水平沉降位移峰值曲线"; //标题
graphic.getPane().YAxis.Title.Text = "峰值/mm";
}
break;
case 19:
//"4#活塞杆水平沉降位移曲线"
if (comboBox1.SelectedIndex == 0)
{
tool.getBeatValue(list1, row);//获取第n列的跳动数据
graphic.CreatGraphics(zedGraphControl1, list1, "yyyy-MM-dd ", DateUnit.Day);
graphic.getPane().Title.Text = "4#活塞杆水平沉降位移跳动曲线"; //标题
graphic.getPane().YAxis.Title.Text = "跳动/mm";
}
if (comboBox1.SelectedIndex == 1)
{
tool.getPeakVaule(list1, row);//获取第n列的峰值数据
graphic.CreatGraphics(zedGraphControl1, list1, "yyyy-MM-dd ", DateUnit.Day);
graphic.getPane().Title.Text = "4#活塞杆水平沉降位移峰值曲线"; //标题
graphic.getPane().YAxis.Title.Text = "峰值/mm";
}
break;
case 20:
//"1#活塞杆垂直沉降位移曲线"
if (comboBox1.SelectedIndex == 0)
{
tool.getBeatValue(list1, row);//获取第n列的跳动数据
graphic.CreatGraphics(zedGraphControl1, list1, "yyyy-MM-dd ", DateUnit.Day);
graphic.getPane().Title.Text = "1#活塞杆垂直沉降位移跳动曲线"; //标题
graphic.getPane().YAxis.Title.Text = "跳动/mm";
}
if (comboBox1.SelectedIndex == 1)
{
tool.getPeakVaule(list1, row);//获取第n列的峰值数据
graphic.CreatGraphics(zedGraphControl1, list1, "yyyy-MM-dd ", DateUnit.Day);
graphic.getPane().Title.Text = "1#活塞杆垂直沉降位移峰值曲线"; //标题
graphic.getPane().YAxis.Title.Text = "峰值/mm";
}
break;
case 21:
//"2#活塞杆垂直沉降位移曲线"
if (comboBox1.SelectedIndex == 0)
{
tool.getBeatValue(list1, row);//获取第n列的跳动数据
graphic.CreatGraphics(zedGraphControl1, list1, "yyyy-MM-dd ", DateUnit.Day);
graphic.getPane().Title.Text = "2#活塞杆垂直沉降位移跳动曲线"; //标题
graphic.getPane().YAxis.Title.Text = "跳动/mm";
}
if (comboBox1.SelectedIndex == 1)
{
tool.getPeakVaule(list1, row);//获取第n列的峰值数据
graphic.CreatGraphics(zedGraphControl1, list1, "yyyy-MM-dd ", DateUnit.Day);
graphic.getPane().Title.Text = "2#活塞杆垂直沉降位移峰值曲线"; //标题
graphic.getPane().YAxis.Title.Text = "峰值/mm";
}
break;
case 22:
//"3#活塞杆垂直沉降位移曲线"
if (comboBox1.SelectedIndex == 0)
{
tool.getBeatValue(list1, row);//获取第n列的跳动数据
graphic.CreatGraphics(zedGraphControl1, list1, "yyyy-MM-dd ", DateUnit.Day);
graphic.getPane().Title.Text = "3#活塞杆垂直沉降位移跳动曲线"; //标题
graphic.getPane().YAxis.Title.Text = "跳动/mm";
}
if (comboBox1.SelectedIndex == 1)
{
tool.getPeakVaule(list1, row);//获取第n列的峰值数据
graphic.CreatGraphics(zedGraphControl1, list1, "yyyy-MM-dd ", DateUnit.Day);
graphic.getPane().Title.Text = "3#活塞杆垂直沉降位移峰值曲线"; //标题
graphic.getPane().YAxis.Title.Text = "峰值/mm";
}
break;
case 23:
//"4#活塞杆垂直沉降位移曲线"
if (comboBox1.SelectedIndex == 0)
{
tool.getBeatValue(list1, row);//获取第n列的跳动数据
graphic.CreatGraphics(zedGraphControl1, list1, "yyyy-MM-dd ", DateUnit.Day);
graphic.getPane().Title.Text = "4#活塞杆垂直沉降位移跳动曲线"; //标题
graphic.getPane().YAxis.Title.Text = "跳动/mm";
}
if (comboBox1.SelectedIndex == 1)
{
tool.getPeakVaule(list1, row);//获取第n列的峰值数据
graphic.CreatGraphics(zedGraphControl1, list1, "yyyy-MM-dd ", DateUnit.Day);
graphic.getPane().Title.Text = "4#活塞杆垂直沉降位移峰值曲线"; //标题
graphic.getPane().YAxis.Title.Text = "峰值/mm";
}
break;
case 24:
//"1#曲轴水平振动曲线"
if (comboBox1.SelectedIndex == 0)
{
tool.getEffectValue(list1, row);//获取第n列的有效值数据
graphic.CreatGraphics(zedGraphControl1, list1, "yyyy-MM-dd ", DateUnit.Day);
graphic.getPane().Title.Text = "1#曲轴水平振动有效值曲线"; //标题
graphic.getPane().YAxis.Title.Text = "加速度有效值/g";
}
if (comboBox1.SelectedIndex == 1)
{
tool.getPeakVaule(list1, row);//获取第n列的峰值数据
graphic.CreatGraphics(zedGraphControl1, list1, "yyyy-MM-dd ", DateUnit.Day);
graphic.getPane().Title.Text = "1#曲轴水平振动峰值曲线"; //标题
graphic.getPane().YAxis.Title.Text = "加速度峰值/g";
}
break;
case 25:
//"2#曲轴水平振动曲线"
if (comboBox1.SelectedIndex == 0)
{
tool.getEffectValue(list1, row);//获取第n列的有效值数据
graphic.CreatGraphics(zedGraphControl1, list1, "yyyy-MM-dd ", DateUnit.Day);
graphic.getPane().Title.Text = "2#曲轴水平振动有效值曲线"; //标题
graphic.getPane().YAxis.Title.Text = "加速度有效值/g";
}
if (comboBox1.SelectedIndex == 1)
{
tool.getPeakVaule(list1, row);//获取第n列的峰值数据
graphic.CreatGraphics(zedGraphControl1, list1, "yyyy-MM-dd ", DateUnit.Day);
graphic.getPane().Title.Text = "2#曲轴水平振动峰值曲线"; //标题
graphic.getPane().YAxis.Title.Text = "加速度峰值/g";
}
break;
case 26:
//"1#曲轴箱振动曲线"
if (comboBox1.SelectedIndex == 0)
{
tool.getEffectValue(list1, row);//获取第n列的有效值数据
graphic.CreatGraphics(zedGraphControl1, list1, "yyyy-MM-dd ", DateUnit.Day);
graphic.getPane().Title.Text = "1#曲轴箱振动有效值曲线"; //标题
graphic.getPane().YAxis.Title.Text = "加速度有效值/g";
}
if (comboBox1.SelectedIndex == 1)
{
tool.getPeakVaule(list1, row);//获取第n列的峰值数据
graphic.CreatGraphics(zedGraphControl1, list1, "yyyy-MM-dd ", DateUnit.Day);
graphic.getPane().Title.Text = "1#曲轴箱振动峰值曲线"; //标题
graphic.getPane().YAxis.Title.Text = "加速度峰值/g";
}
break;
case 27:
//"1#曲轴垂直振动曲线"
if (comboBox1.SelectedIndex == 0)
{
tool.getEffectValue(list1, row);//获取第n列的有效值数据
graphic.CreatGraphics(zedGraphControl1, list1, "yyyy-MM-dd ", DateUnit.Day);
graphic.getPane().Title.Text = "1#曲轴垂直振动有效值曲线"; //标题
graphic.getPane().YAxis.Title.Text = "加速度有效值/g";
}
if (comboBox1.SelectedIndex == 1)
{
tool.getPeakVaule(list1, row);//获取第n列的峰值数据
graphic.CreatGraphics(zedGraphControl1, list1, "yyyy-MM-dd ", DateUnit.Day);
graphic.getPane().Title.Text = "1#曲轴垂直振动峰值曲线"; //标题
graphic.getPane().YAxis.Title.Text = "加速度峰值/g";
}
break;
case 28:
//"2#曲轴垂直振动曲线"
if (comboBox1.SelectedIndex == 0)
{
tool.getEffectValue(list1, row);//获取第n列的有效值数据
graphic.CreatGraphics(zedGraphControl1, list1, "yyyy-MM-dd ", DateUnit.Day);
graphic.getPane().Title.Text = "2#曲轴垂直振动有效值曲线"; //标题
graphic.getPane().YAxis.Title.Text = "加速度有效值/g";
}
if (comboBox1.SelectedIndex == 1)
{
tool.getPeakVaule(list1, row);//获取第n列的峰值数据
graphic.CreatGraphics(zedGraphControl1, list1, "yyyy-MM-dd ", DateUnit.Day);
graphic.getPane().Title.Text = "2#曲轴垂直振动峰值曲线"; //标题
graphic.getPane().YAxis.Title.Text = "加速度峰值/g";
}
break;
case 29:
//"2#曲轴箱振动曲线"
if (comboBox1.SelectedIndex == 0)
{
tool.getEffectValue(list1, row);//获取第n列的有效值数据
graphic.CreatGraphics(zedGraphControl1, list1, "yyyy-MM-dd ", DateUnit.Day);
graphic.getPane().Title.Text = "2#曲轴箱振动有效值曲线"; //标题
graphic.getPane().YAxis.Title.Text = "加速度有效值/g";
}
if (comboBox1.SelectedIndex == 1)
{
tool.getPeakVaule(list1, row);//获取第n列的峰值数据
graphic.CreatGraphics(zedGraphControl1, list1, "yyyy-MM-dd ", DateUnit.Day);
graphic.getPane().Title.Text = "2#曲轴箱振动峰值曲线"; //标题
graphic.getPane().YAxis.Title.Text = "加速度峰值/g";
}
break;
case 30:
//"转速报警曲线"
break;
case 31:
//"相位报警曲线"
break;
default: break;
}
graphic.getPane().XAxis.Title.Text = "年/月/日"; //X轴标题
zedGraphControl1.Refresh();
}
private void listBox1_SelectedIndexChanged(object sender, EventArgs e)
{
switch (listBox1.SelectedIndex)
{
case 0:
row = 0;
empty();
getAllDate(row);
comboBox1.Items.AddRange(new object[] { "4#气缸振动有效值曲线", "4#气缸振动峰值曲线" });
break;//选择第一列
case 1:
row = 1;
empty();
getAllDate(row);
comboBox1.Items.AddRange(new object[] { "3#气缸振动有效值曲线", "3#气缸振动峰值曲线" });
break;//选择第二列
case 2:
row = 2;
empty();
getAllDate(row);
comboBox1.Items.AddRange(new object[] { "2#气缸振动有效值曲线", "2#气缸振动峰值曲线" });
break;//选择第三列
case 3:
row = 3;
empty();
getAllDate(row);
comboBox1.Items.AddRange(new object[] { "1#气缸振动有效值曲线", "1#气缸振动峰值曲线" });
break;//
case 4:
row = 4;
empty();//清空图表和下拉框
getAllDate(row);
comboBox1.Items.AddRange(new object[] { "1#中体振动有效值曲线", "1#中体振动峰值曲线" });
break;
case 5:
row = 5;
empty();
getAllDate(row);
comboBox1.Items.AddRange(new object[] { "2#中体振动有效值曲线", "2#中体振动峰值曲线" });
break;
case 6:
row = 6; empty(); getAllDate(row);
comboBox1.Items.AddRange(new object[] { "3#中体振动有效值曲线", "3#中体振动峰值曲线" }); break;
case 7:
row = 7; empty(); getAllDate(row);
comboBox1.Items.AddRange(new object[] { "4#中体振动有效值曲线", "4#中体振动峰值曲线" }); break;
case 8:
row = 8; empty(); getAllDate(row);
comboBox1.Items.AddRange(new object[] { "1#中体噪声有效值曲线", "1#中体噪声峰值曲线" }); break;
case 9:
row = 9; empty(); getAllDate(row);
comboBox1.Items.AddRange(new object[] { "2#中体噪声有效值曲线", "2#中体噪声峰值曲线" }); break;//
case 10:
row = 10; empty(); getAllDate(row);
comboBox1.Items.AddRange(new object[] { "3#中体噪声有效值曲线", "3#中体噪声峰值曲线" }); break;
case 11:
row = 11; empty(); getAllDate(row);
comboBox1.Items.AddRange(new object[] { "4#中体噪声有效值曲线", "4#中体噪声峰值曲线" }); break;
case 12:
row = 12; empty(); getAllDate(row);
break;
case 13:
row = 13; empty(); getAllDate(row);
break;
case 14: row = 14; empty(); getAllDate(row); break;
case 15: row = 15; empty(); getAllDate(row); break;//
case 16:
row = 16; empty(); getAllDate(row);
comboBox1.Items.AddRange(new object[] { "1#活塞杆水平沉降位移跳动曲线", "1#活塞杆水平沉降位移峰值曲线" }); break;
case 17:
row = 17; empty(); getAllDate(row);
comboBox1.Items.AddRange(new object[] { "2#活塞杆水平沉降位移跳动曲线", "2#活塞杆水平沉降位移峰值曲线" }); break;
case 18:
row = 18; empty(); getAllDate(row);
comboBox1.Items.AddRange(new object[] { "3#活塞杆水平沉降位移跳动曲线", "3#活塞杆水平沉降位移峰值曲线" }); break;
case 19:
row = 19; empty(); getAllDate(row);
comboBox1.Items.AddRange(new object[] { "4#活塞杆水平沉降位移跳动曲线", "4#活塞杆水平沉降位移峰值曲线" }); break;
case 20:
row = 20; empty(); getAllDate(row);
comboBox1.Items.AddRange(new object[] { "1#活塞杆垂直沉降位移跳动曲线", "1#活塞杆垂直沉降位移峰值曲线" }); break;
case 21:
row = 21; empty(); getAllDate(row);
comboBox1.Items.AddRange(new object[] { "2#活塞杆垂直沉降位移跳动曲线", "2#活塞杆垂直沉降位移峰值曲线" }); break;//
case 22:
row = 22; empty(); getAllDate(row);
comboBox1.Items.AddRange(new object[] { "3#活塞杆垂直沉降位移跳动曲线", "3#活塞杆垂直沉降位移峰值曲线" }); break;
case 23:
row = 23; empty(); getAllDate(row);
comboBox1.Items.AddRange(new object[] { "4#活塞杆垂直沉降位移跳动曲线", "4#活塞杆垂直沉降位移峰值曲线" }); break;
case 24:
row = 24; empty(); getAllDate(row);
comboBox1.Items.AddRange(new object[] { "1#曲轴水平振动有效值曲线", "1#曲轴水平振动峰值曲线" }); break;
case 25:
row = 25; empty(); getAllDate(row);
comboBox1.Items.AddRange(new object[] { "2#曲轴水平振动有效值曲线", "2#曲轴水平振动峰值曲线" }); break;
case 26:
row = 26; empty(); getAllDate(row);
comboBox1.Items.AddRange(new object[] { "1#曲轴箱振动有效值曲线", "1#曲轴箱振动峰值曲线" }); break;
case 27:
row = 27; empty(); getAllDate(row);
comboBox1.Items.AddRange(new object[] { "1#曲轴垂直振动有效值曲线", "1#曲轴垂直振动峰值曲线" }); break;//
case 28:
row = 28; empty(); getAllDate(row);
comboBox1.Items.AddRange(new object[] { "2#曲轴垂直振动有效值曲线", "2#曲轴垂直振动峰值曲线" }); break;
case 29:
row = 29; empty(); getAllDate(row);
comboBox1.Items.AddRange(new object[] { "2#曲轴箱振动有效值曲线", "2#曲轴箱振动峰值曲线" }); break;
case 30: row = 30; empty(); getAllDate(row); break;
case 31: row = 31; empty(); getAllDate(row); break; //第32列
default: empty(); comboBox1.Items.Clear(); break;
}
}
}
}
 指定时间的图形
 指定类型的曲线