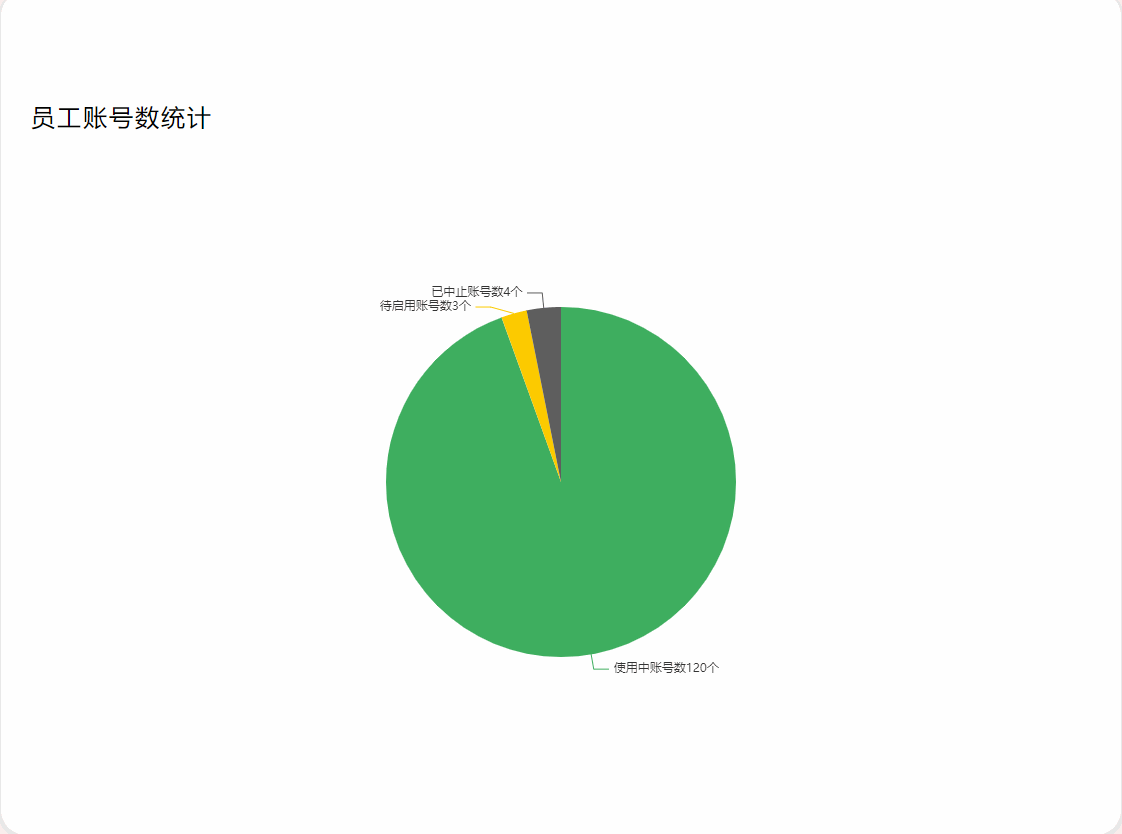
1、先展示效果图
2、直接上代码,把我代码copy拿去调一下就知道了(引用echarts插件看之前的文章)
<template>
  <div class="employee-container">
    <div class="top-content">
      <span class="top-title">员工账号数统计</span>
    </div>
    <div id="statistical-chart"></div>
  </div>
</template>

<script>
  import {


    mapState
  } from 'vuex'
  export default {


    name: "EmployeeDataStatistics",
    data() {


      return {


        chartBox: null
      };
    },
    computed: {


      ...mapState(["employeeDataStatus"]) // 接口返回的数据存储在这里
    },
    created() {

    },
    mounted() {


      this.echart()
    },

    methods: {


      // 2. echart图表
      echart() {


        if (this.chartBox != null && this.chartBox != "" && this.chartBox != undefined) {


          this.chartBox.dispose() //销毁
        }
        this.chartBox = this.$echarts.init(document.getElementById("statistical-chart"));
        const option = {


          tooltip: {


            trigger: 'item'
          },
          color: ['#3eae5f', '#fcca00', '#5e5e5e'],
          series: [{


            name: '员工账号数据统计',
            type: 'pie',
            radius: '50%',
            data: [{


                value: this.employeeDataStatus[1].quantity,
                name: this.employeeDataStatus[1].statusDescription + '账号数' + this.employeeDataStatus[1]
                  .quantity + '个'
              },
              {


                value: this.employeeDataStatus[2].quantity,
                name: this.employeeDataStatus[2].statusDescription + '账号数' + this.employeeDataStatus[2]
                  .quantity + '个'
              },
              {


                value: this.employeeDataStatus[3].quantity,
                name: this.employeeDataStatus[3].statusDescription + '账号数' + this.employeeDataStatus[3]
                  .quantity + '个'
              }
            ],
            emphasis: {


              itemStyle: {


                shadowBlur: 10,
                shadowOffsetX: 0,
                shadowColor: 'rgba(0, 0, 0, 0.5)'
              }
            }
          }]
        };
        this.chartBox.setOption(option);
        // 根据页面大小自动响应图表大小
        // window.addEventListener("resize", function () {


        //   this.chartBox.resize();
        // });
      },
    },
  };
</script>

<style lang="scss" scoped>
  .employee-container {


    width: 100%;
    height: 100%;
    padding-top: 20px;
    display: flex;
    flex-direction: column;
    align-items: center;

    .top-content {


      width: 100%;
      display: flex;

      .top-title {


        font-size: 24px;
        letter-spacing: 2px;
        margin-left: 30px;
      }
    }

    #statistical-chart {


      width: 900px;
      height: 700px;
    }
  }
</style>