在前端界面接收后端数据后,将数据赋值给ECharts中的data时出现了,数据读取失败的问题(可能是由于数据渲染的前后顺序问题)。后通过如下方式进行了解决:
1、接下来将介绍UserController中的countUsers方法,用于返回管理员以及普通用户的数目。首先,定义一个JSONArray对象用于存储JSONObject对象。然后分别定义两个JSONObject对象用于存储管理员以及普通用户的相关信息。调用Service层中的countRoot()和countGeneral()方法,返回管理员和普通用户的数目。通过put()方法向JSONObject中添加键值对,最终将两个JSONObject通过add()方法添加到JSONArray中,最终返回。代码如下所示。
@GetMapping("/countUsers")
    public Object countUsers() {


        JSONArray jsonArray = new JSONArray();

        JSONObject rootUser = new JSONObject();
        int rootNum = userService.countRoot();
        rootUser.put("value", rootNum);
        rootUser.put("name", "管理员");
        jsonArray.add(rootUser);

        JSONObject generalUser = new JSONObject();
        int generalNum = userService.countGeneral();
        generalUser.put("value", generalNum);
        generalUser.put("name", "普通用户");
        jsonArray.add(generalUser);

        return jsonArray;
    }
2、前端界面调用接口,接收返回的jsonArray,并将接收到的JSON数组赋值给this.userValue,然后调用creatUserChart方法,最终实现用户统计图的显示。
creatUserChart() {


      var myChart = echarts.init(document.getElementById('userChart'));
      myChart.setOption({


        title: {


          text: "用户信息",
          x: "center",
          y: "310px"
        },
        color: ['#41719f', '#8dccfc'],
        tooltip: {


          trigger: 'item'
        },
        legend: {


          top: '5%',
          left: 'center'
        },
        series: [
          {


            name: '用户数量',
            type: 'pie',
            radius: ['40%', '70%'],
            avoidLabelOverlap: false,
            itemStyle: {


              borderRadius: 10,
              borderColor: '#fff',
              borderWidth: 2
            },
            label: {


              show: false,
              position: 'center'
            },
            emphasis: {


              label: {


                show: true,
                fontSize: 30,
                fontWeight: 'bold'
              }
            },
            labelLine: {


              show: false,
            },
            data: this.userValue
          }
        ]
      })
    }

countUser() {


      api.countUsers().then(res => {


        this.userValue = res
        this.creatUserChart()
      })
    },
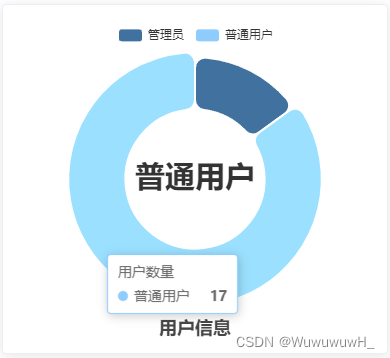
3、最终显示结果如下图所示。